THE Problem

Forest carbon has a credibility problem, and it starts on the ground.

Estimated
Stocks come from plots and generic equations.
A few hand-measured plots, a borrowed biomass equation, scaled up. Each step compounds the error.
Over-credited
The market has learned not to trust the number.
One study found verified credits 121% above independent estimates. Buyers now screen before they pay.
Weak plots
The error sits in the field, not the sky.
In one registry submission, the satellite images barely mattered. Plot location, tree height and wood density did.
Getting harder
Plots get harder as the canopy closes.
As open ground turns to forest, GPS drifts, clinometers struggle and top-down methods lose the stems.
Recurring
Measurement is a cost for decades.
Annual reporting and a field benchmark every five years, bought from third parties again and again.
Unverifiable
An auditor can't revisit a tree that was never recorded.
Plots are re-drawn each campaign and trees aren't tracked, so a verifier has nothing to check against.
From capture to value

Most inventories are a sample dressed up as a census.

The world first
‍end-to-end physical AI in Nature

What you receive

For every single tree,
and for the whole stand.

Per tree
Position
Location and ground elevation, recorded by the robot.
Geometry
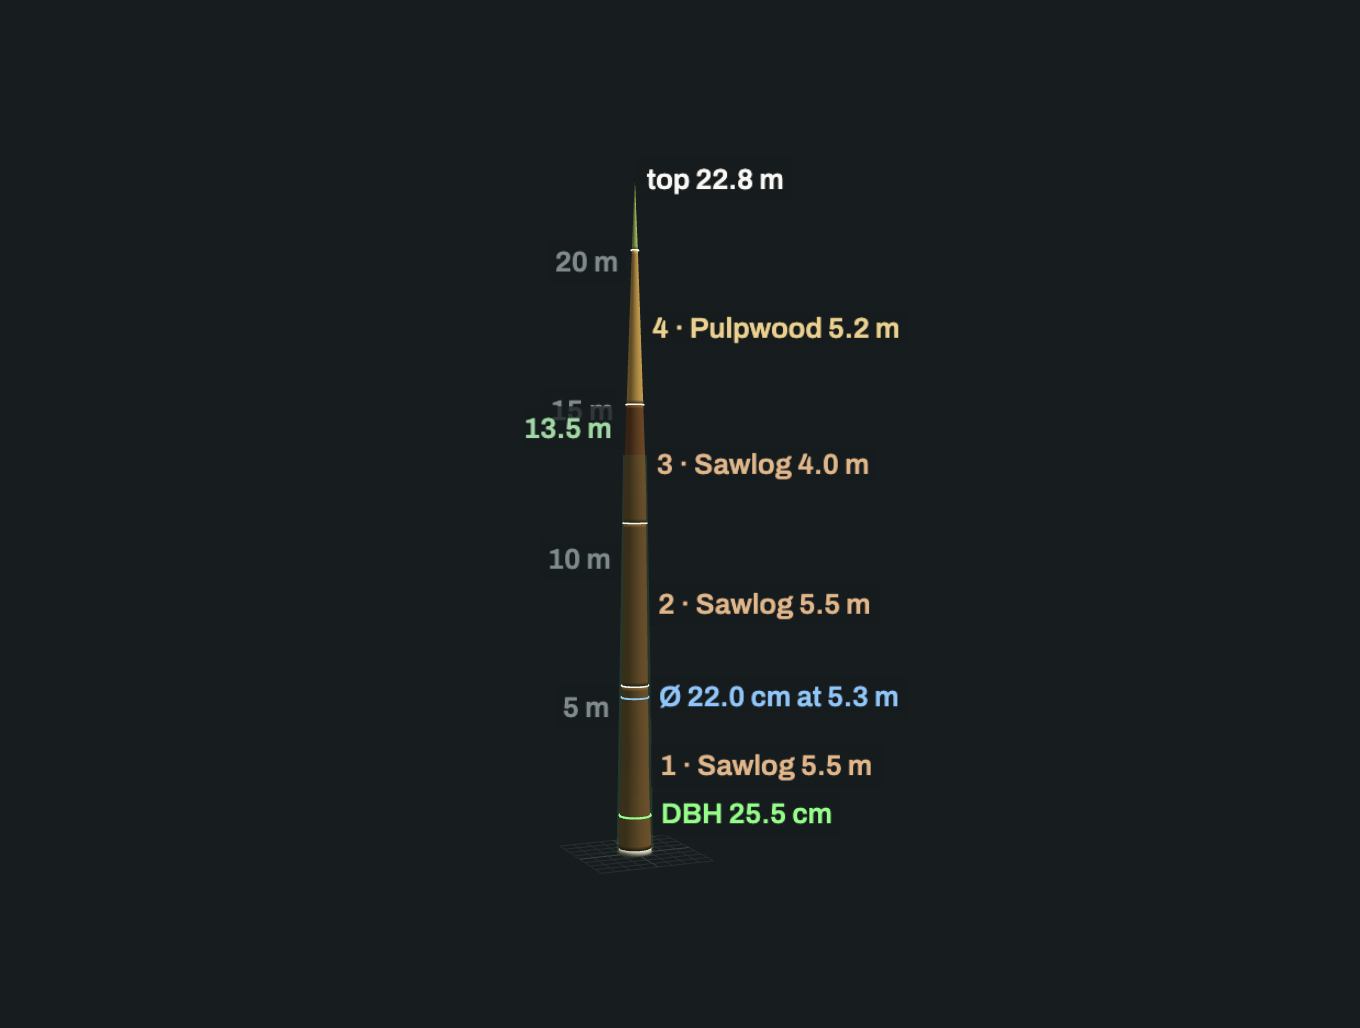
DBH, height, stem curve.
Volume
Measured stem volume and estimated total volume, apart.
Species
For the wood density lookup.
Biomass and carbon
Computed with the equation and density your methodology sets.
Survey quality
Scan count, viewing angles, measured height range.
Verdict
Admitted or excluded, with the reason.
Per plot, stratum, project
Stocking
Trees per hectare, basal area per hectare.
Volume
Per hectare and total.
Biomass and carbon
Per hectare and total, by species.
Distributions
Diameter, height and volume.
Eligible vs contributing
Which trees count toward each total, and why.
Timeline
Difference between survey dates on the same stand.
Audit package
Point clouds
Georeferenced, per plot or stratum.
Run references
Every tree tied to its processing run.
Metric definitions
How each volume was computed: cutoffs, measured vs estimated extent.
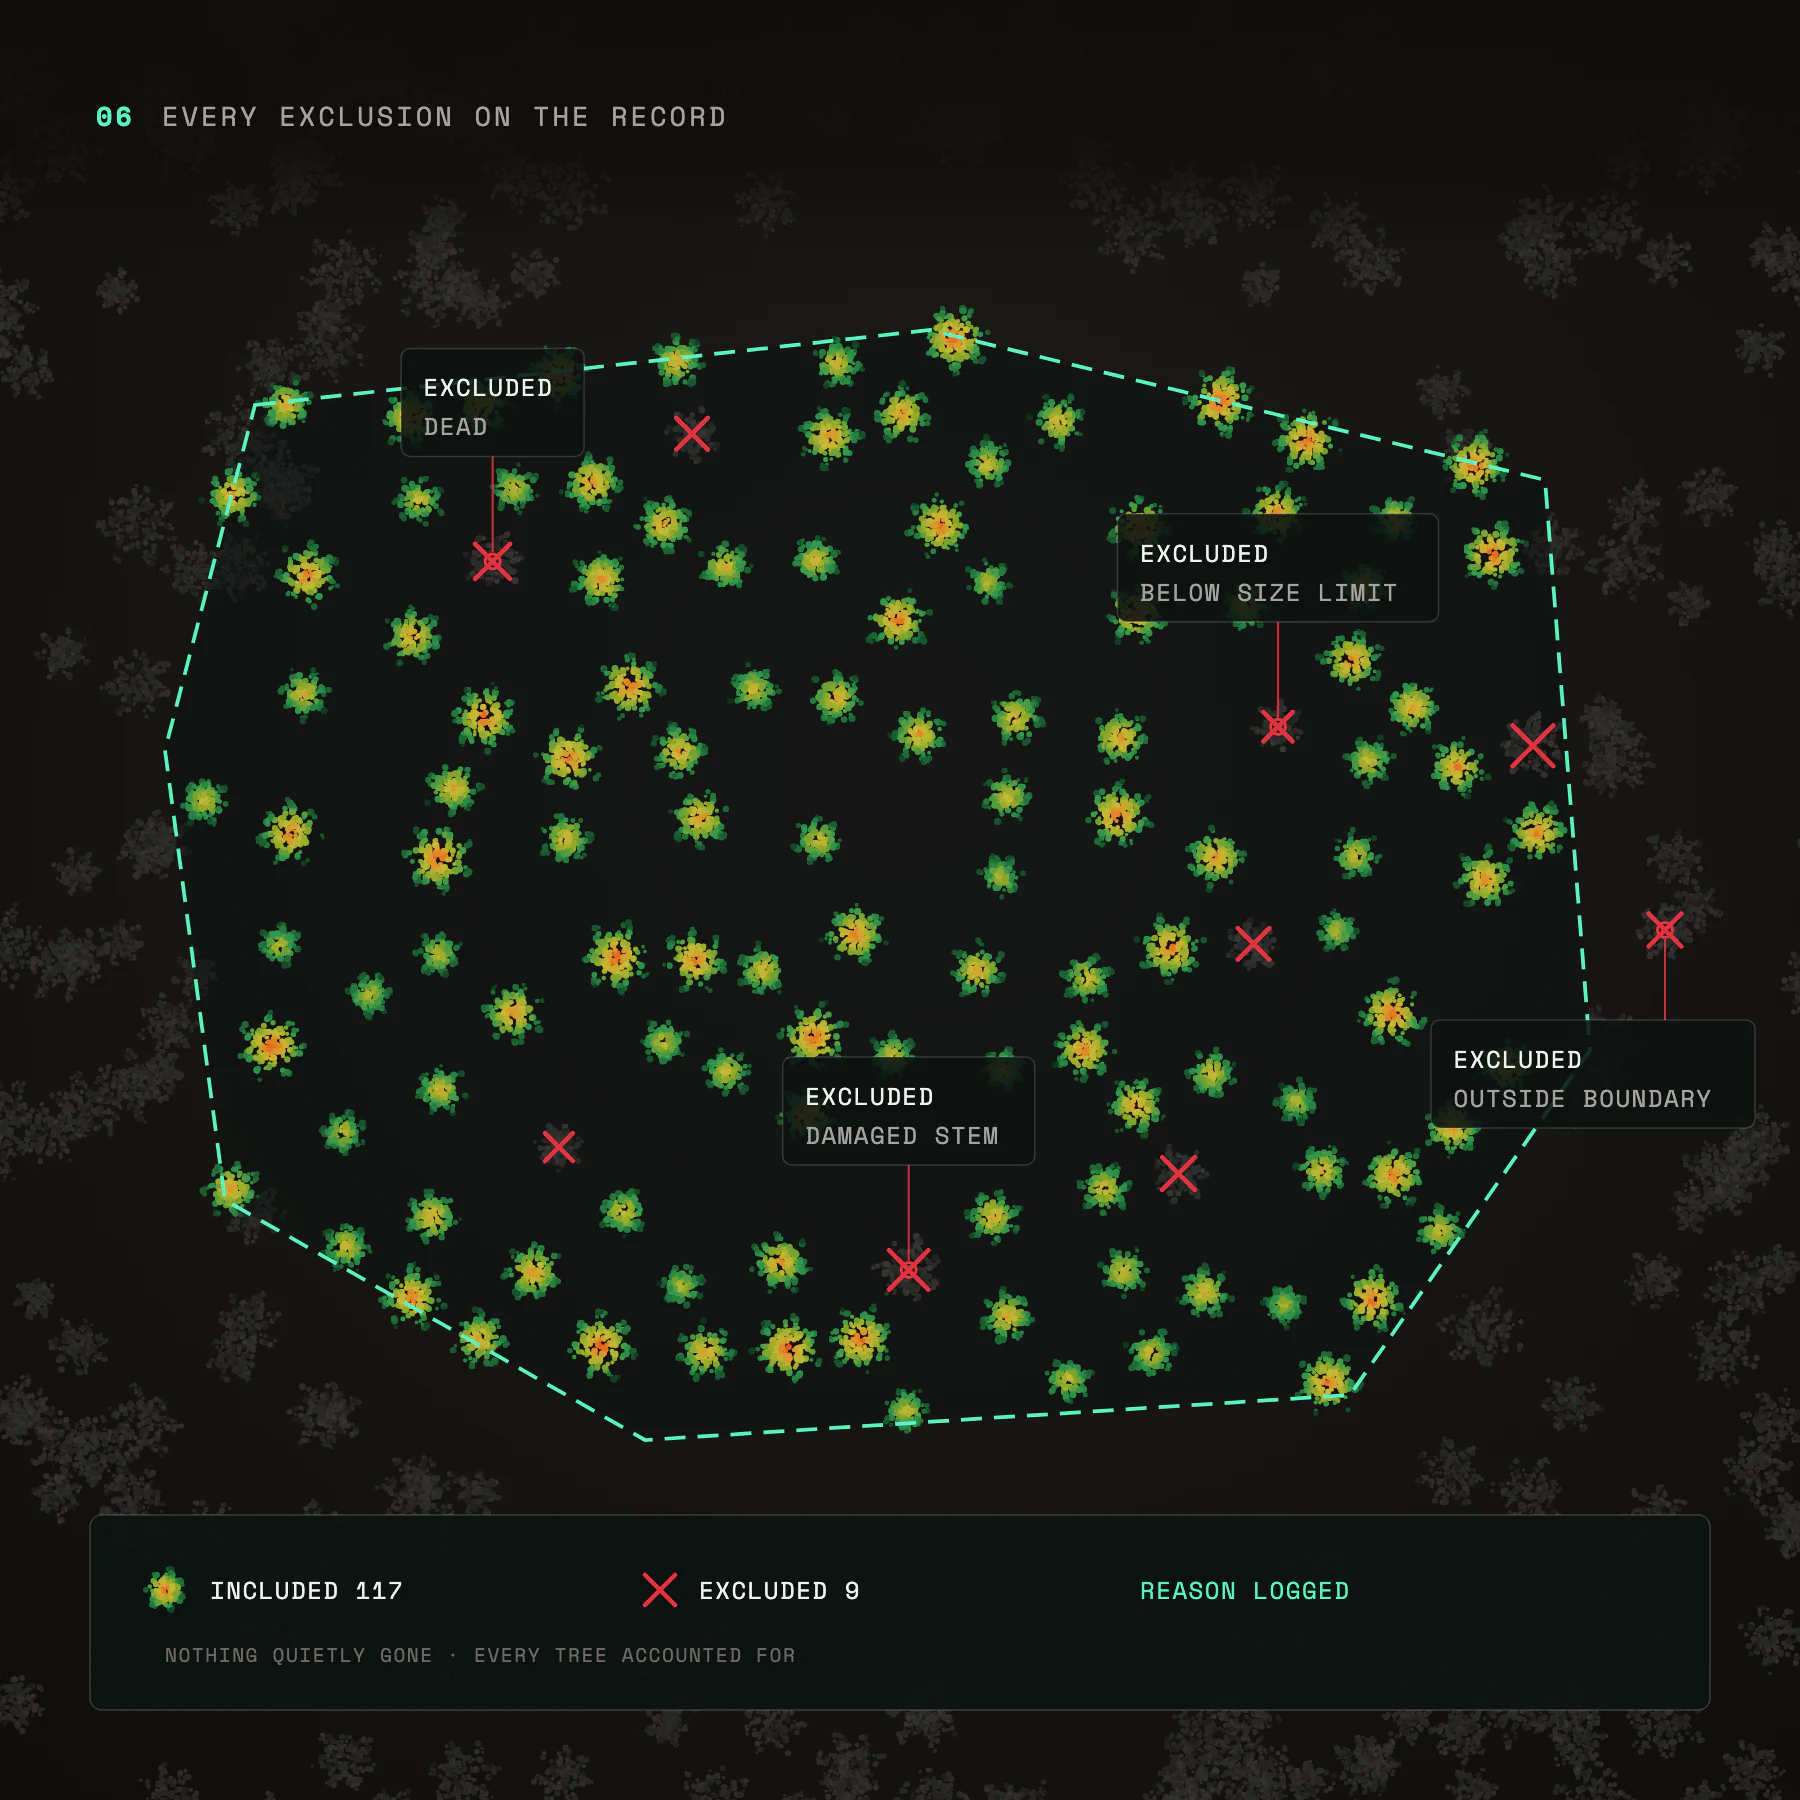
Exclusions
Every tree left out, with a reason.
Coverage
Surveyed area and flight path.
Terrain model
The ground under the canopy.
Outcomes

Every tonne,
traced back to a tree.

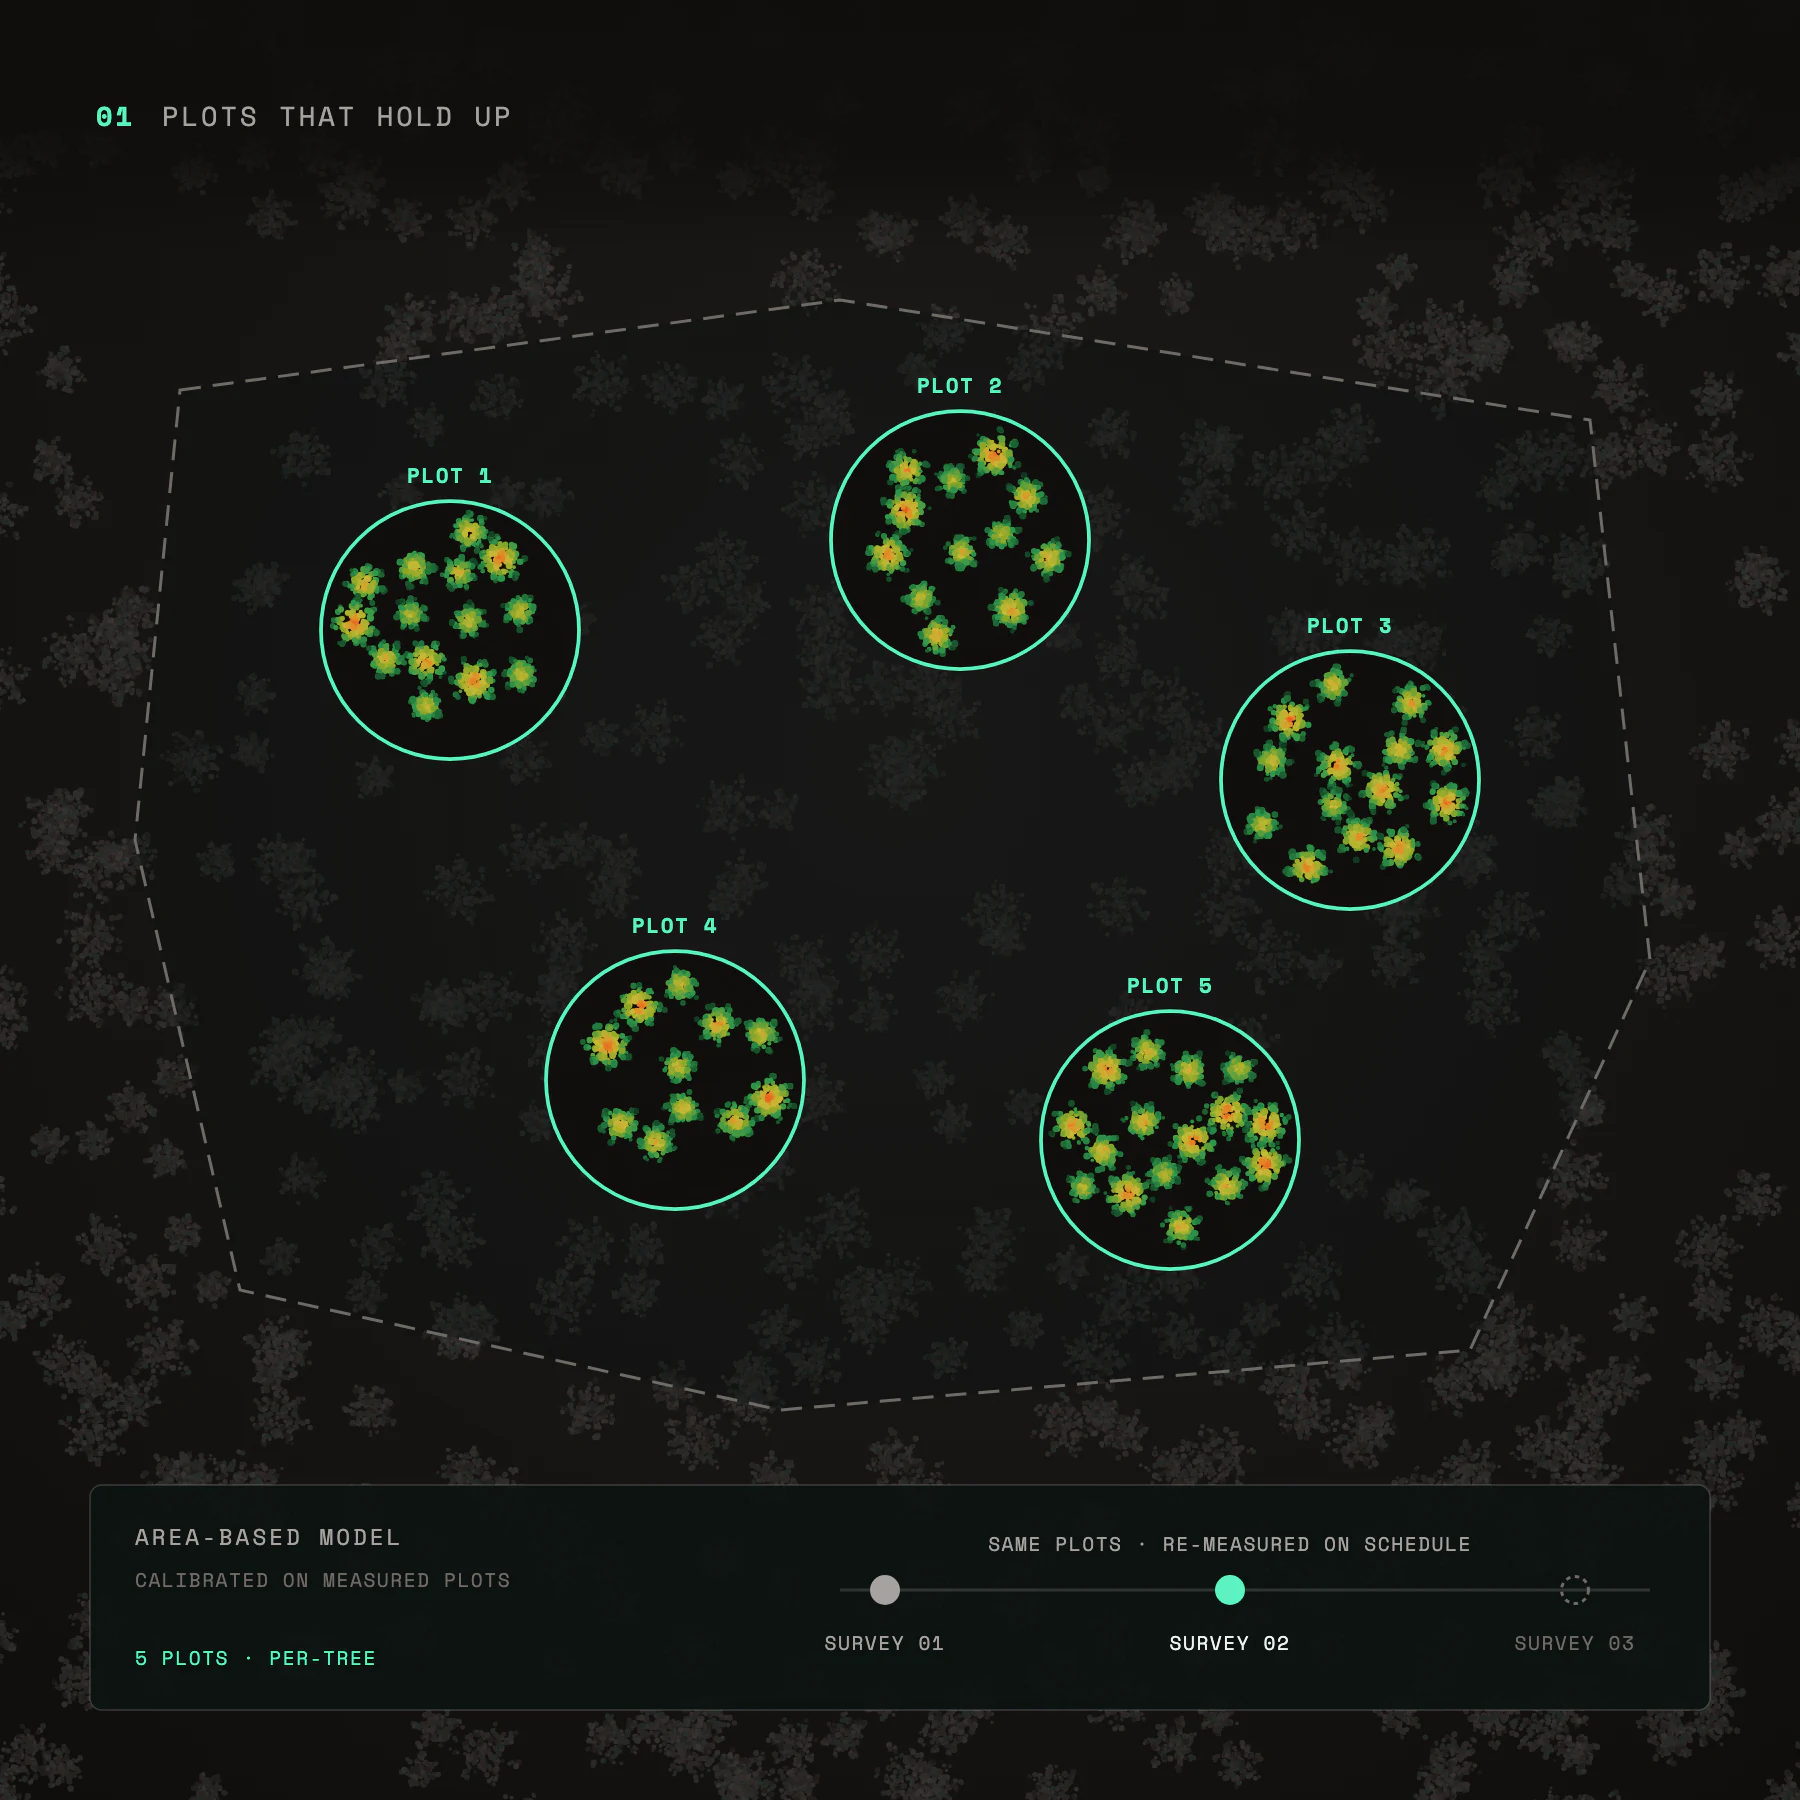
Diagram titled 'Plots That Hold Up' showing five distinct circular plots labeled Plot 1 to Plot 5, each containing green clusters with small orange centers representing trees. A dashed line encloses all plots within a larger irregular polygon. Below is a control panel labeled 'Area-Based Model Calibrated on Measured Plots' with a slider indicating re-measurement on schedule, positioned at Survey 02 between Survey 01 and Survey 03. The note mentions '5 Plots · Per-Tree'.
Plots that hold up
Measured calibration plots for an area-based model, re-measured on schedule.
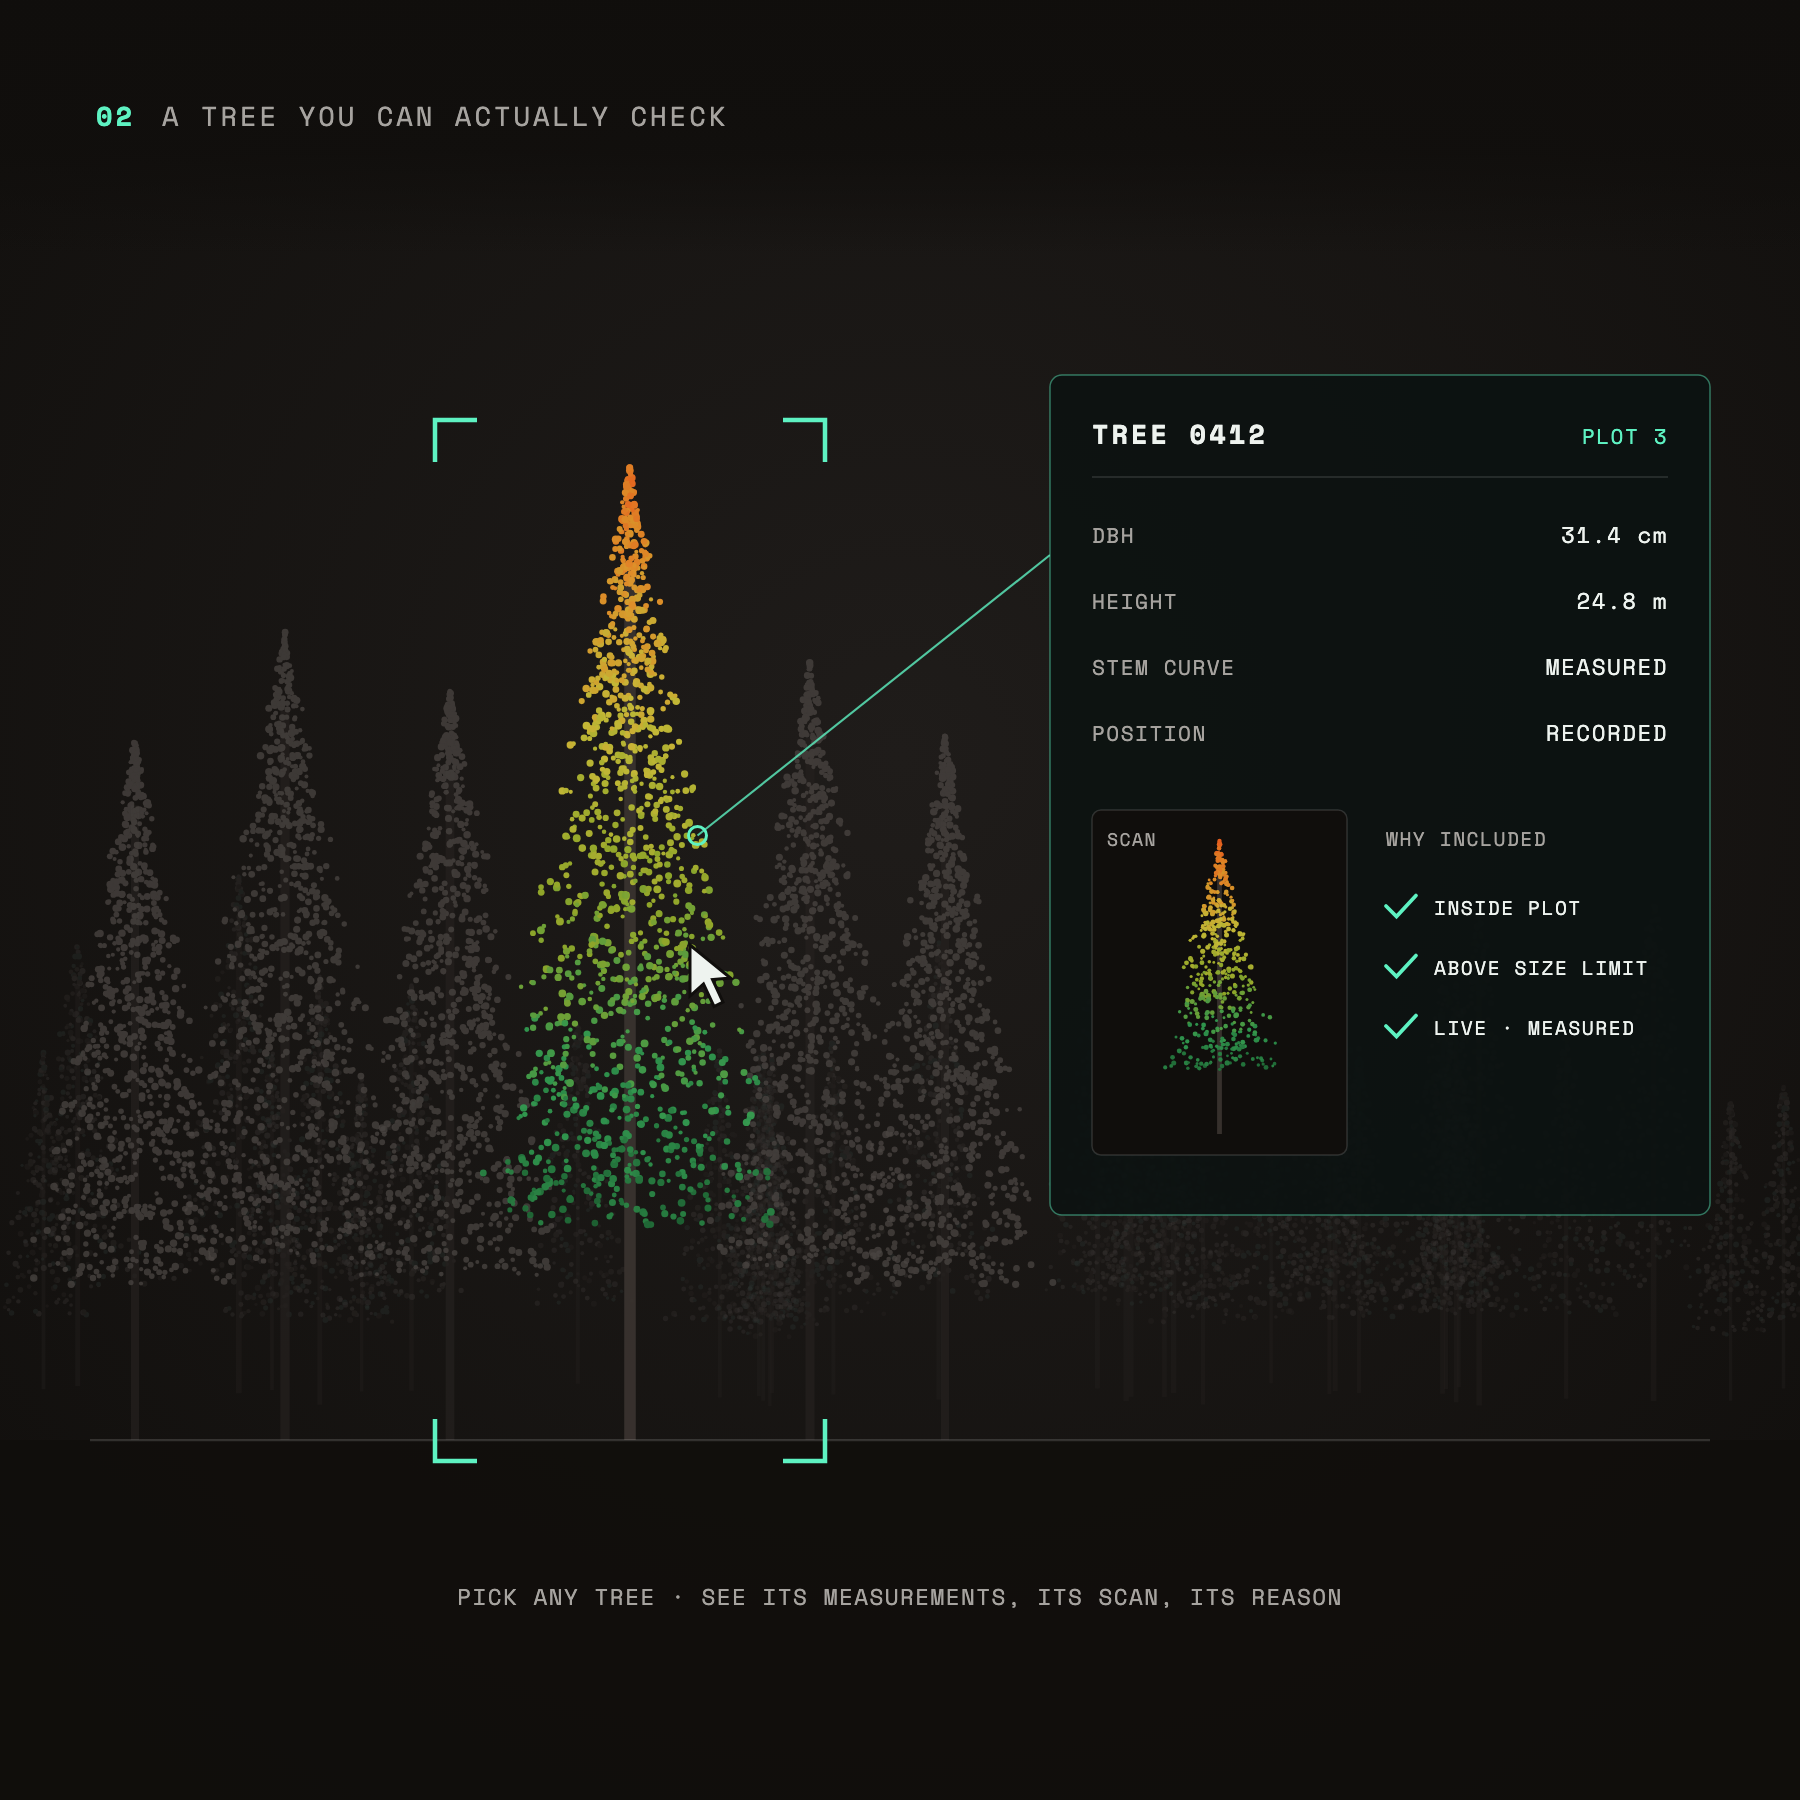
Digital visualization highlighting a single tree in a forest of gray trees, using colored dots transitioning from green at the base to red at the top, representing tree data points. A user cursor points to this tree, labeled TREE 0412 from PLOT 3. Measurements listed include diameter at breast height (31.4 cm), height (24.8 m), stem curve (measured), and position (recorded). Inclusion reasons are inside plot, above size limit, and live measured, all marked with green check marks. Text above reads '02 A TREE YOU CAN ACTUALLY CHECK' and below says 'PICK ANY TREE · SEE ITS MEASUREMENTS, ITS SCAN, ITS REASON.'
A tree you can actually check
Open any tree in a submission to see its measurements, its scan and why it counts.
Illustration showing a credit of 1 tCO2e vintage 2026 traced to 9 measured trees represented by colorful tree shapes with green to orange dots connected to the credit box, emphasizing diligence on trees, not just on a report.
Know what the credit stands on
Diligence on measured, traceable trees, not a report taken on faith.
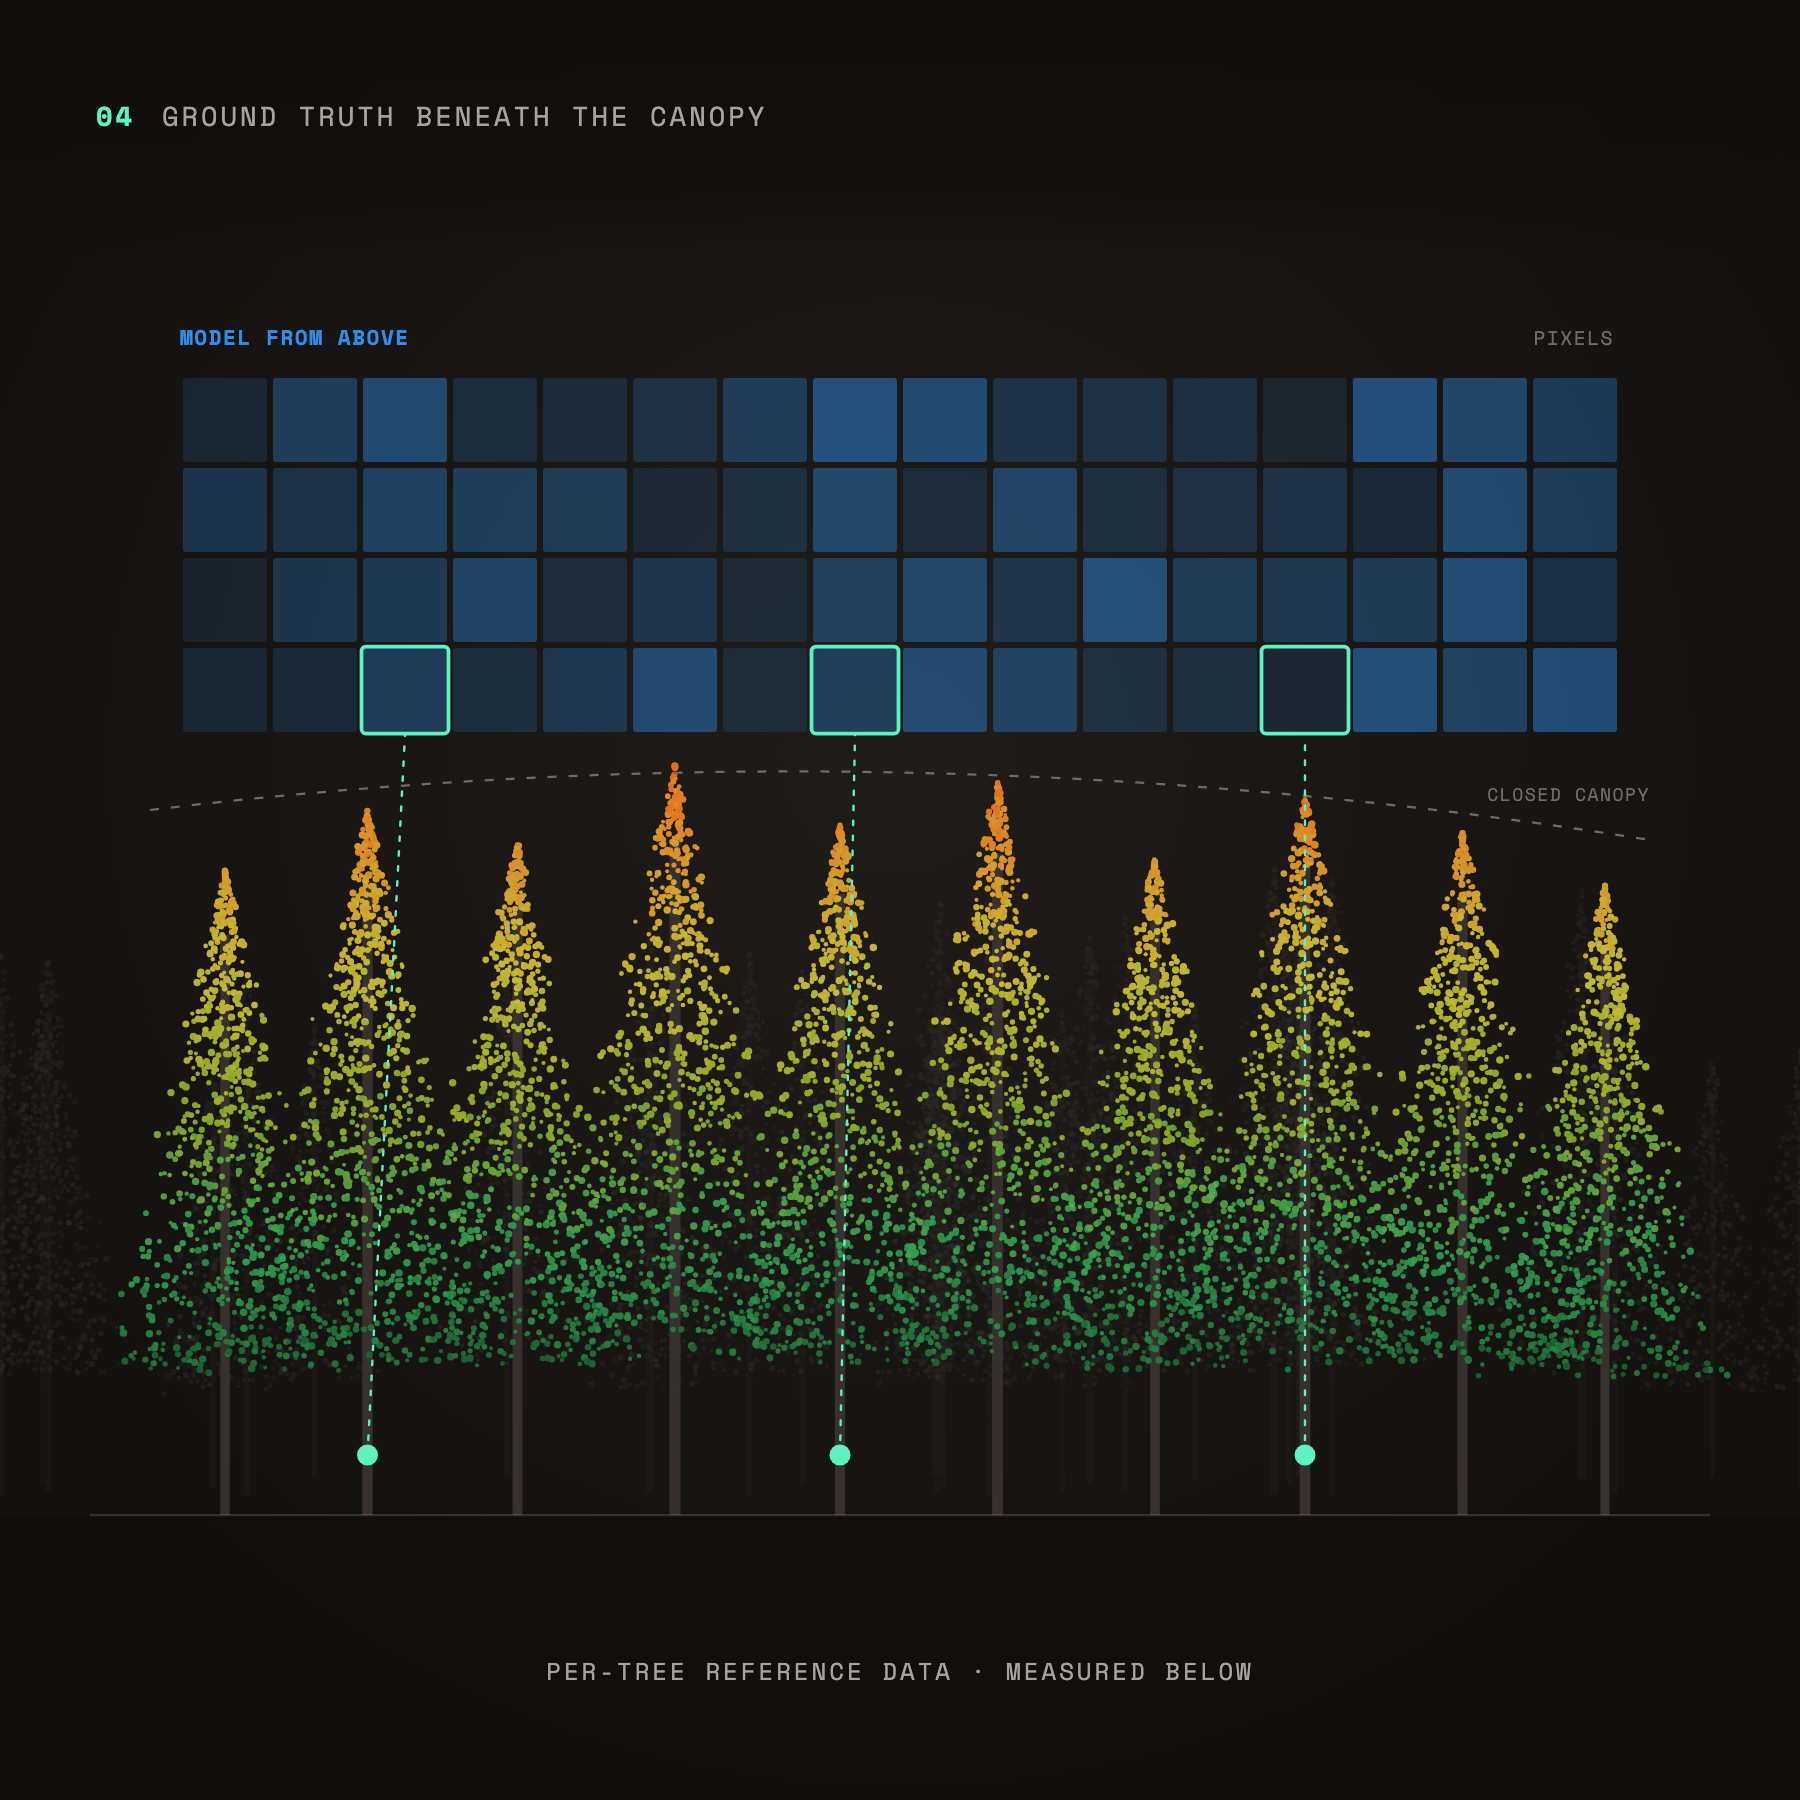
Illustration titled 'Ground Truth Beneath the Canopy' showing a forest cross-section with tall conifer trees colored in gradients from green at the bottom to yellow and orange at the top, indicating data points. Above the trees is a grid labeled 'Model from Above' representing pixels, with three pixels highlighted and connected by dotted lines to specific trees below. A dashed line marks the 'Closed Canopy' level. The bottom text reads 'Per-Tree Reference Data · Measured Below'.
Ground truth beneath the canopy
Per-tree reference data to calibrate and validate carbon models built from above.
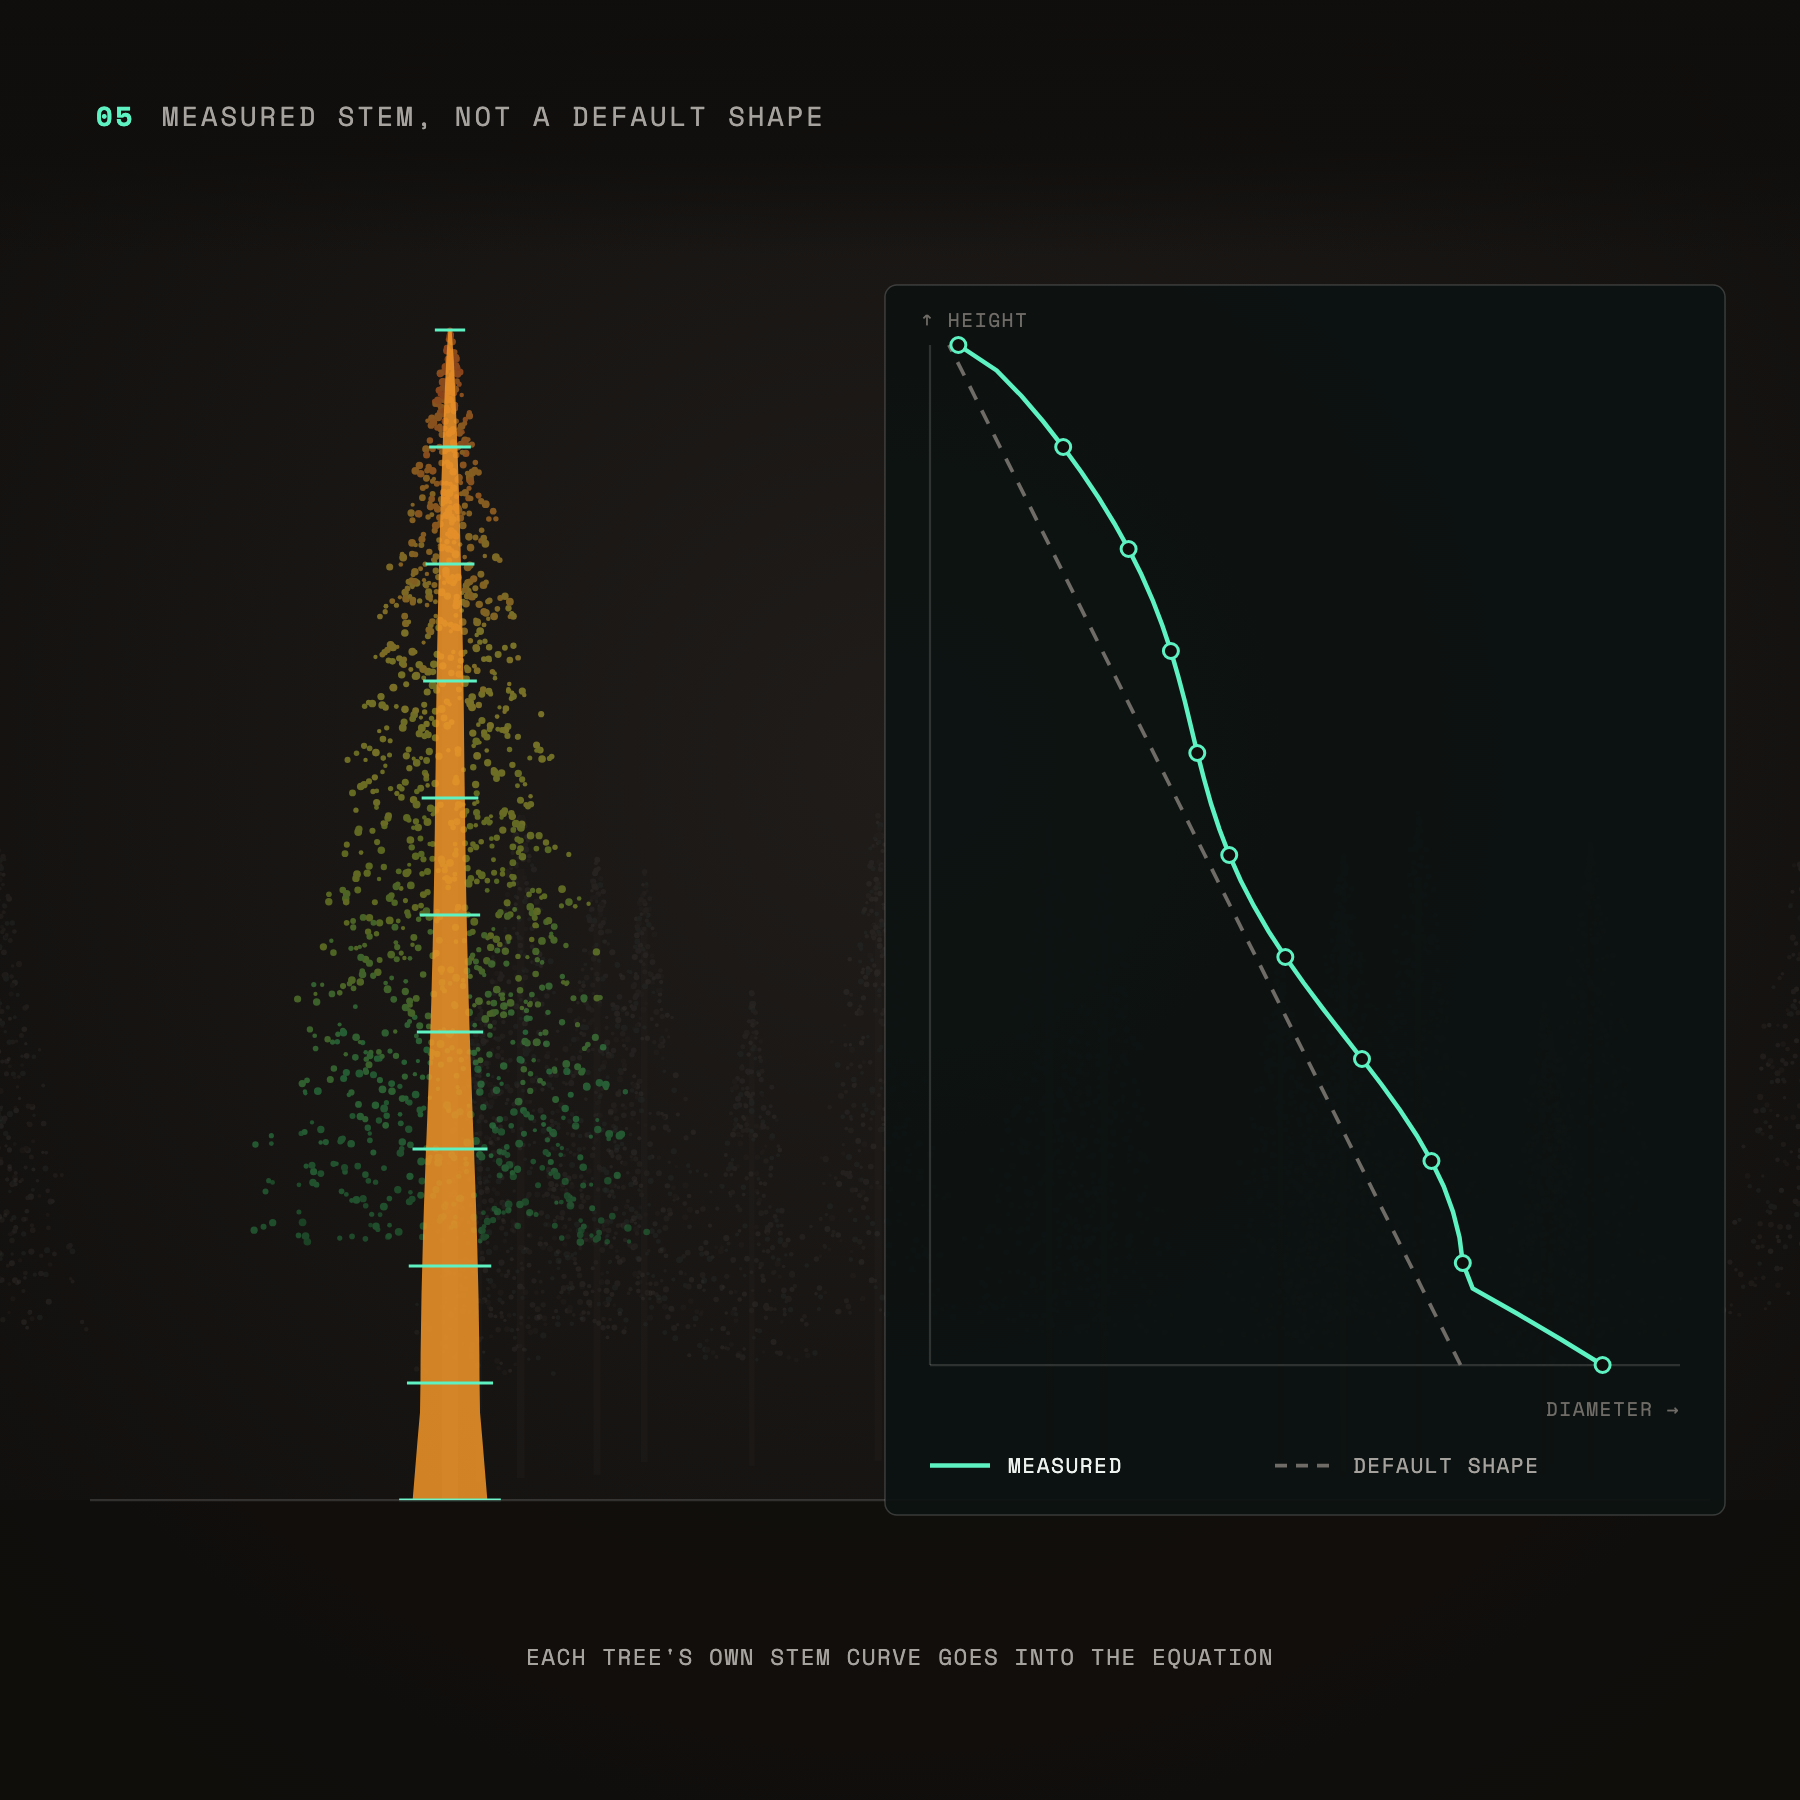
Diagram showing a measured tree stem curve in orange with horizontal markers, alongside a graph comparing the measured stem curve in teal to a default shape in gray dashed line, plotting height versus diameter.
Measured stem, not a default shape
Each tree’s own stem curve goes into the equation, not an assumed one.
Diagram titled '06 Every Exclusion on the Record' showing green and yellow clusters representing included trees within a dashed boundary; red crosses mark excluded trees with reasons labeled including 'Dead', 'Below size limit', 'Damaged stem', and 'Outside boundary'. Legend at bottom indicates 117 included trees and 9 excluded with reasons logged.
Every exclusion on the record
No tree quietly disappears. Every tree left out keeps its reason.
get started now

Pick a stand.
Leave with a number you can defend.