Mapping and navigation

Scroll to learn more
THE Problem

Every map from above stops at the top.

Hidden ground
The terrain under the canopy is an interpolation.
Top-down data sees the ground only through gaps in the cover. Under a closed canopy, terrain is the weakest part of the map.
Unreliable GPS
Positioning breaks exactly where you need it.
Under dense cover, satellite positioning drifts or drops out. Maps built on it inherit the error, and machines get lost.
No obstacles
Maps show where to go, not what's in the way.
A canopy map doesn't show the stems, logs and slopes between them. People and machines find those on arrival.
Slow and risky
Mapping on foot is slow, and sometimes unsafe.
Surveyors walk steep, hazardous ground to fill in what the air can't see. On contested ground, no one should have to go.
Out of date
The map ages the day it is made.
Forests grow, storms fell trees and sites get cleared. Re-mapping on foot is too slow to keep up.
Disconnected
The best ground is the least connected.
Remote sites have no signal, so tools that stream to the cloud while they work don't work there.
From capture to value

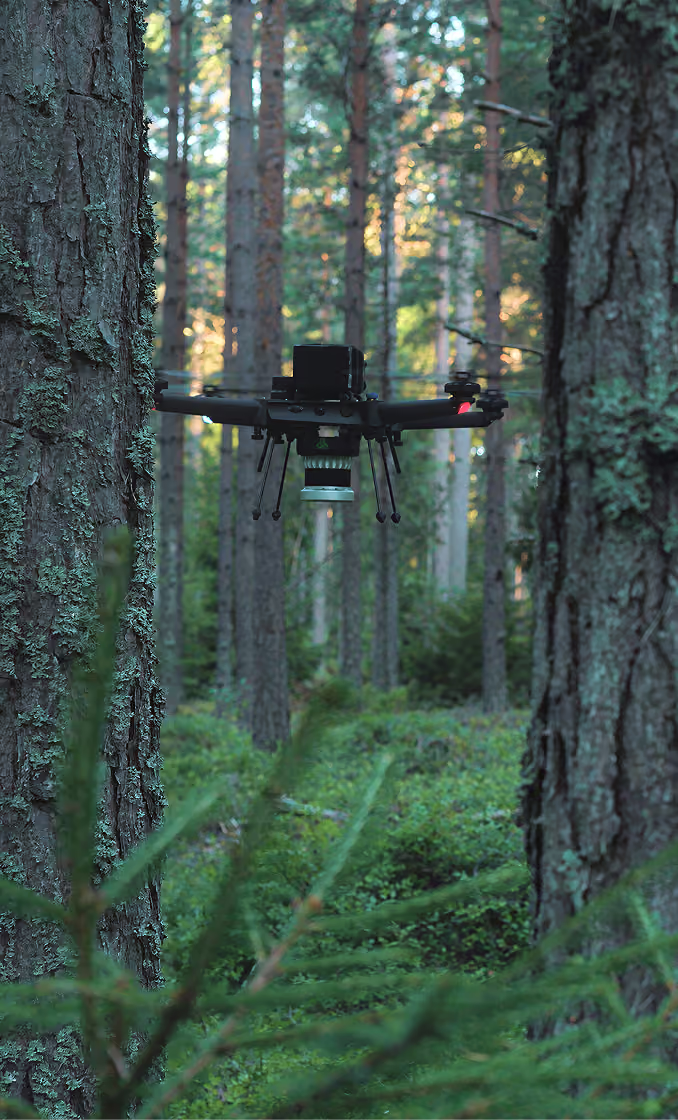
From a flight under cover to a map you can move on.

The world first
‍end-to-end physical AI in Nature

What you receive

Map layers in open formats, ready for your GIS.

Layers
Point cloud
Georeferenced 3D point cloud (LAS 1.4, UTM). Dense: our sample survey holds over 110 million points on less than a hectare.
Terrain model
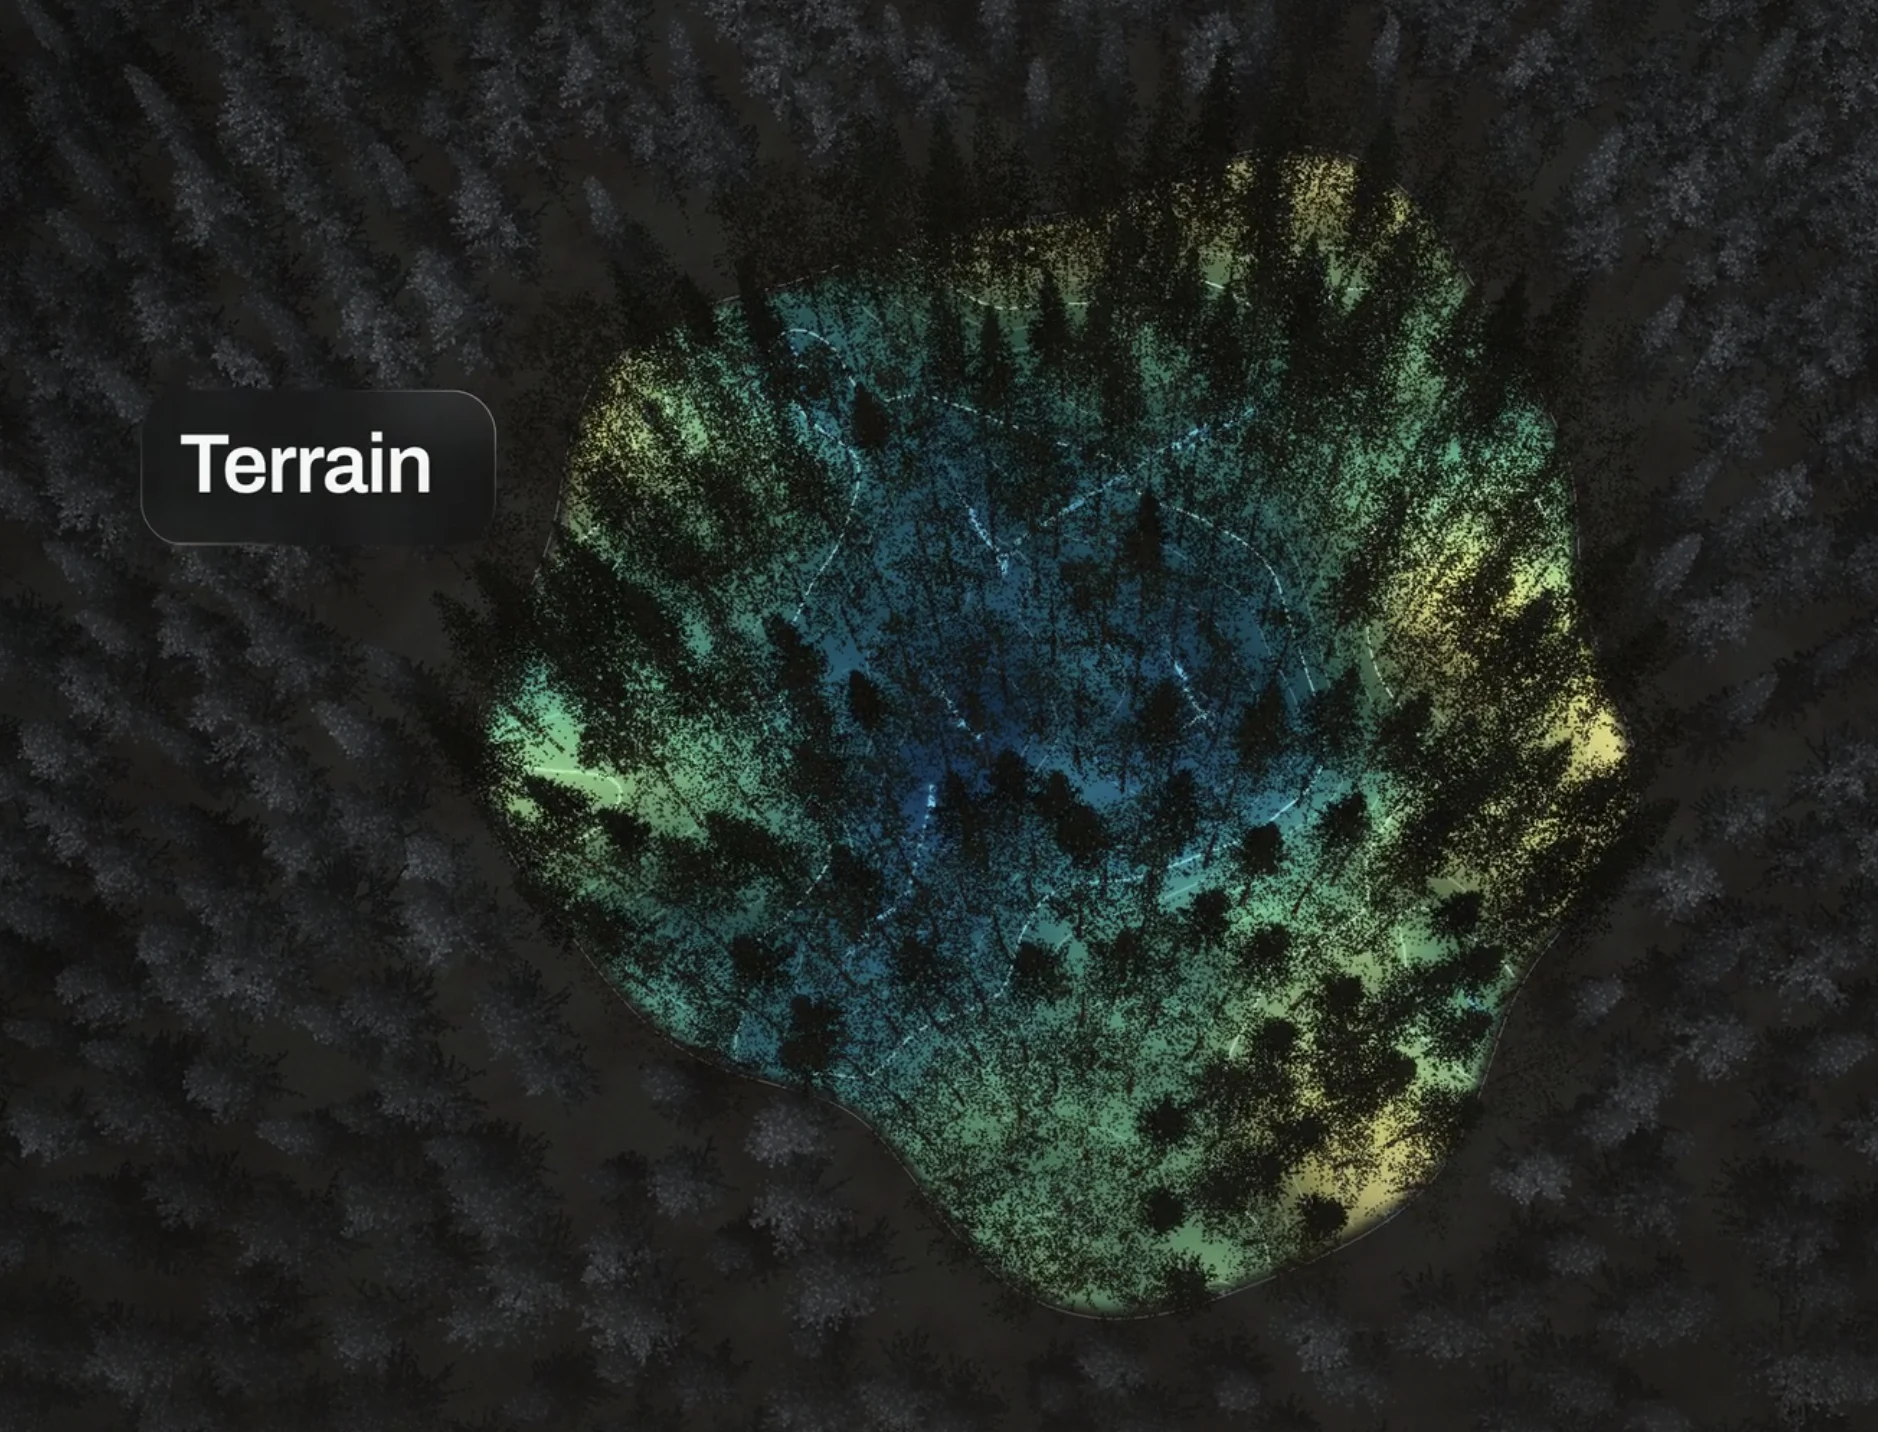
Ground-only digital terrain model at 0.5 m, as GeoTIFF, from beneath the canopy.
Stem map
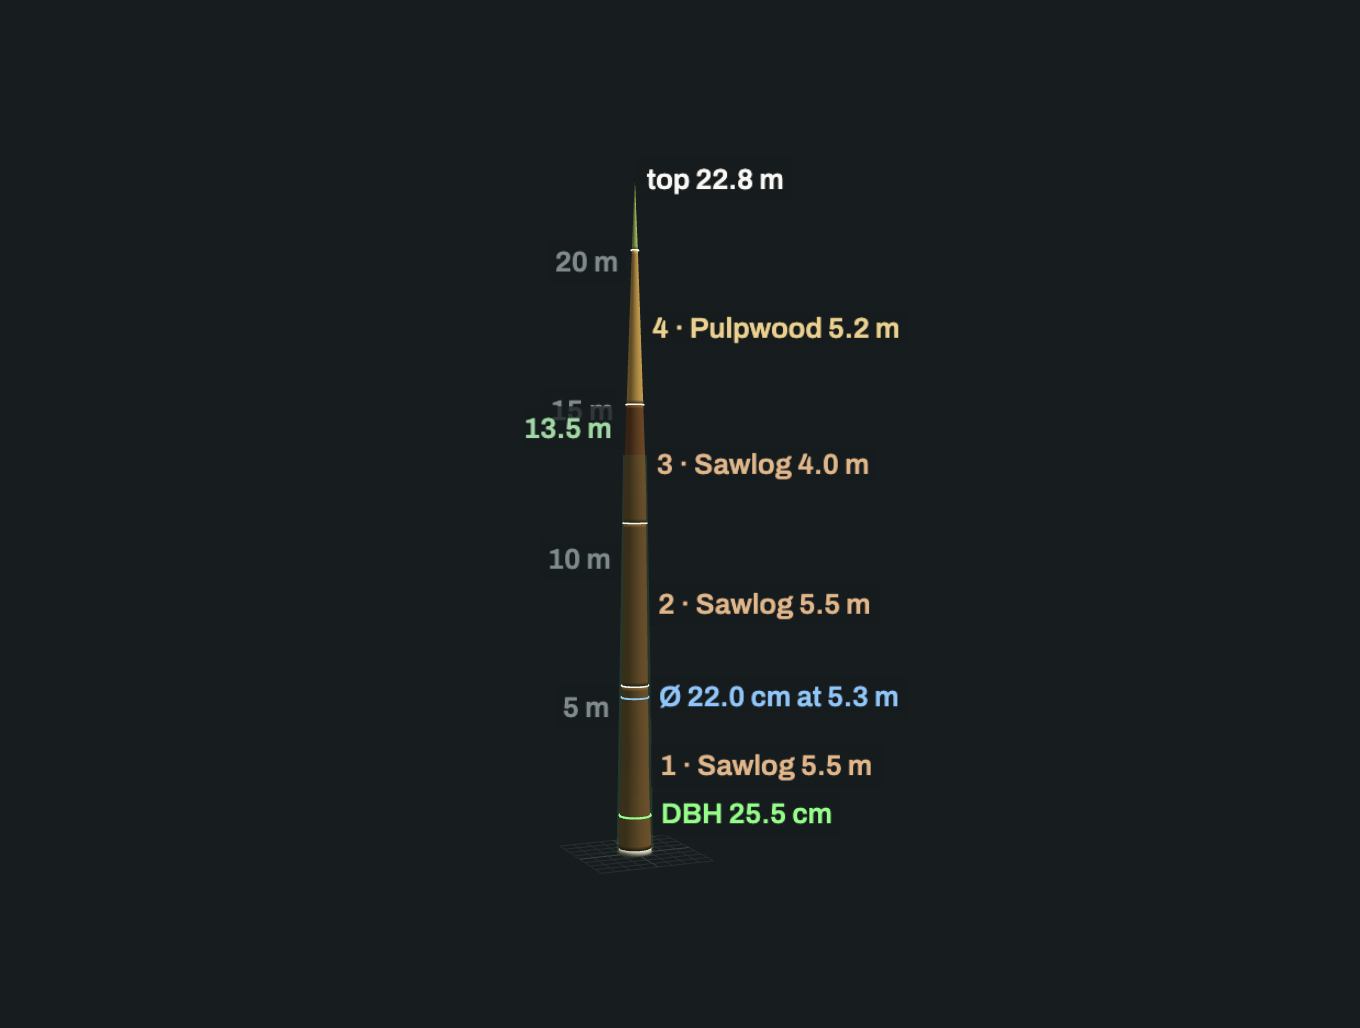
The position and size of every stem: the obstacles between you and where you're going.
Surveyed area
The boundary of what was actually captured, as a polygon.
Flight path
The robot's trajectory, so coverage can be checked.
Merged areas
Several surveys registered into one stand or site, with its boundary.
How it arrives
Formats
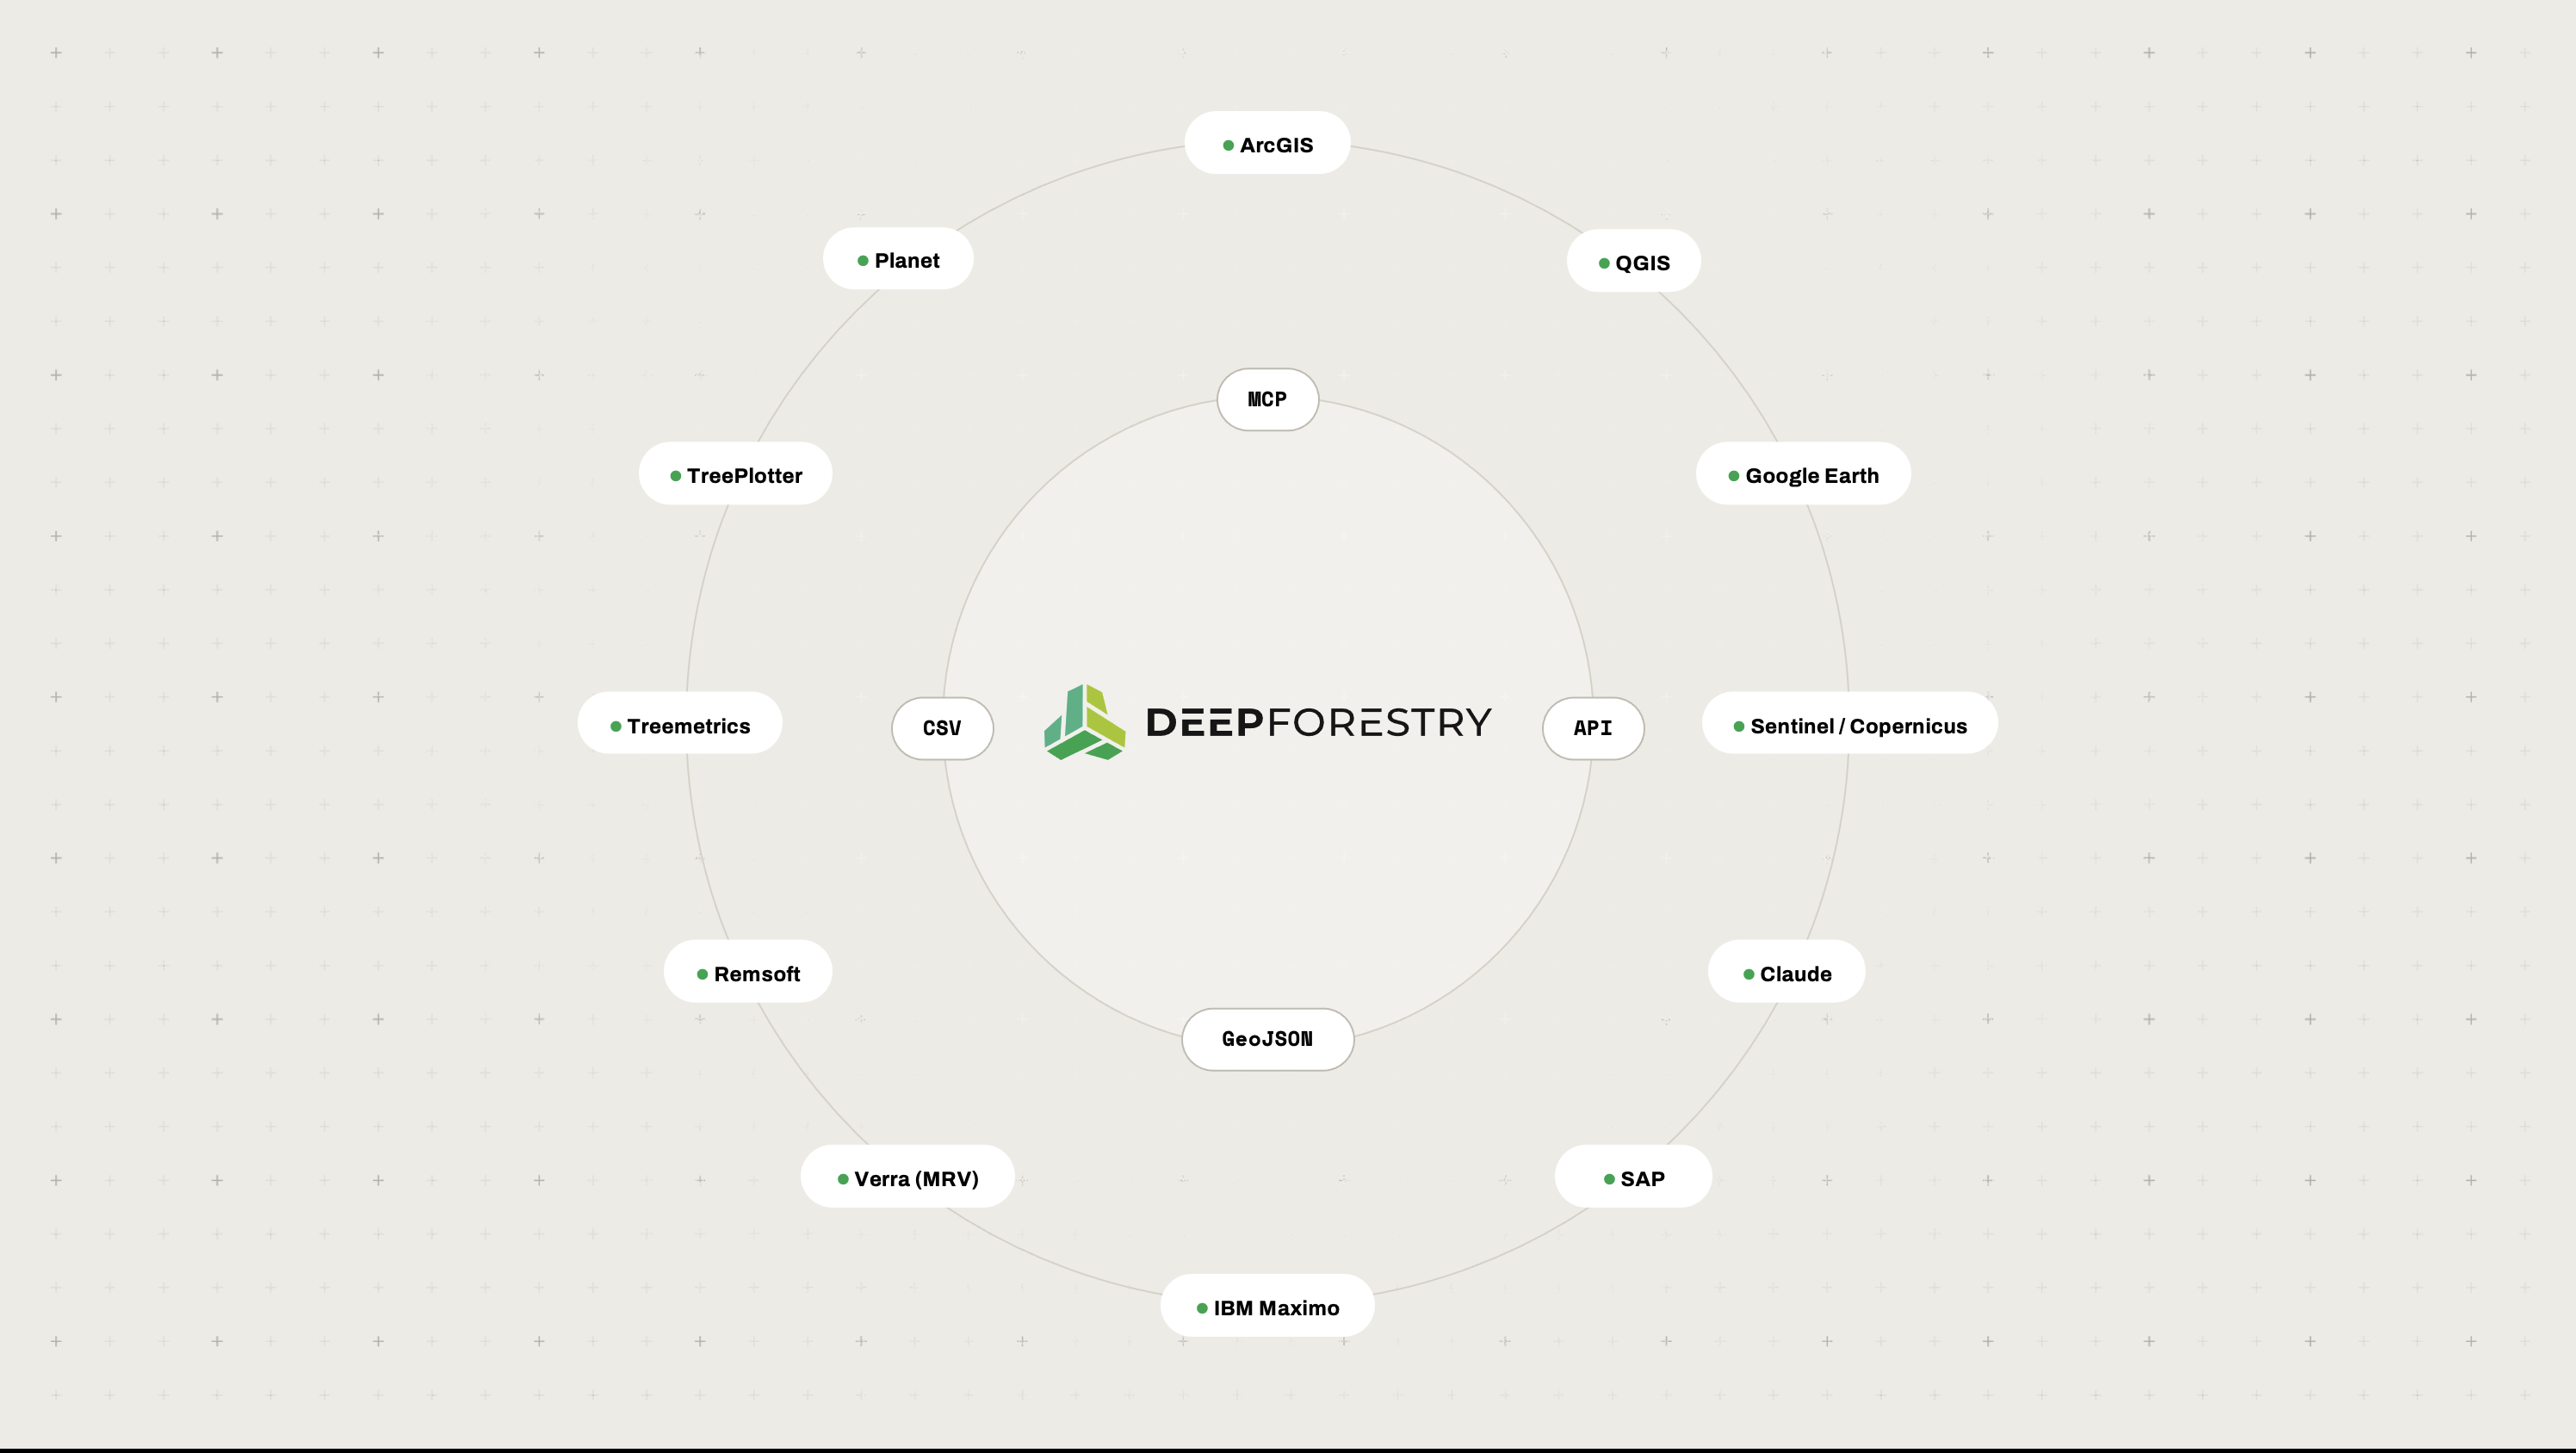
LAS, GeoTIFF, GeoJSON, JSON. Nothing proprietary to import.
Coordinates
WGS84 for vector layers; UTM for the point cloud and terrain model.
Manifest
A machine-readable index of every file, so an integration reads the package instead of guessing.
Tools
Opens directly in QGIS, ArcGIS and CAD workflows.
Application
A 3D view your team can explore without GIS skills.

Point clouds are large (gigabytes per hectare), so we agree how they are delivered at the start.

Outcomes

The ground beneath the cover,mapped and measured.

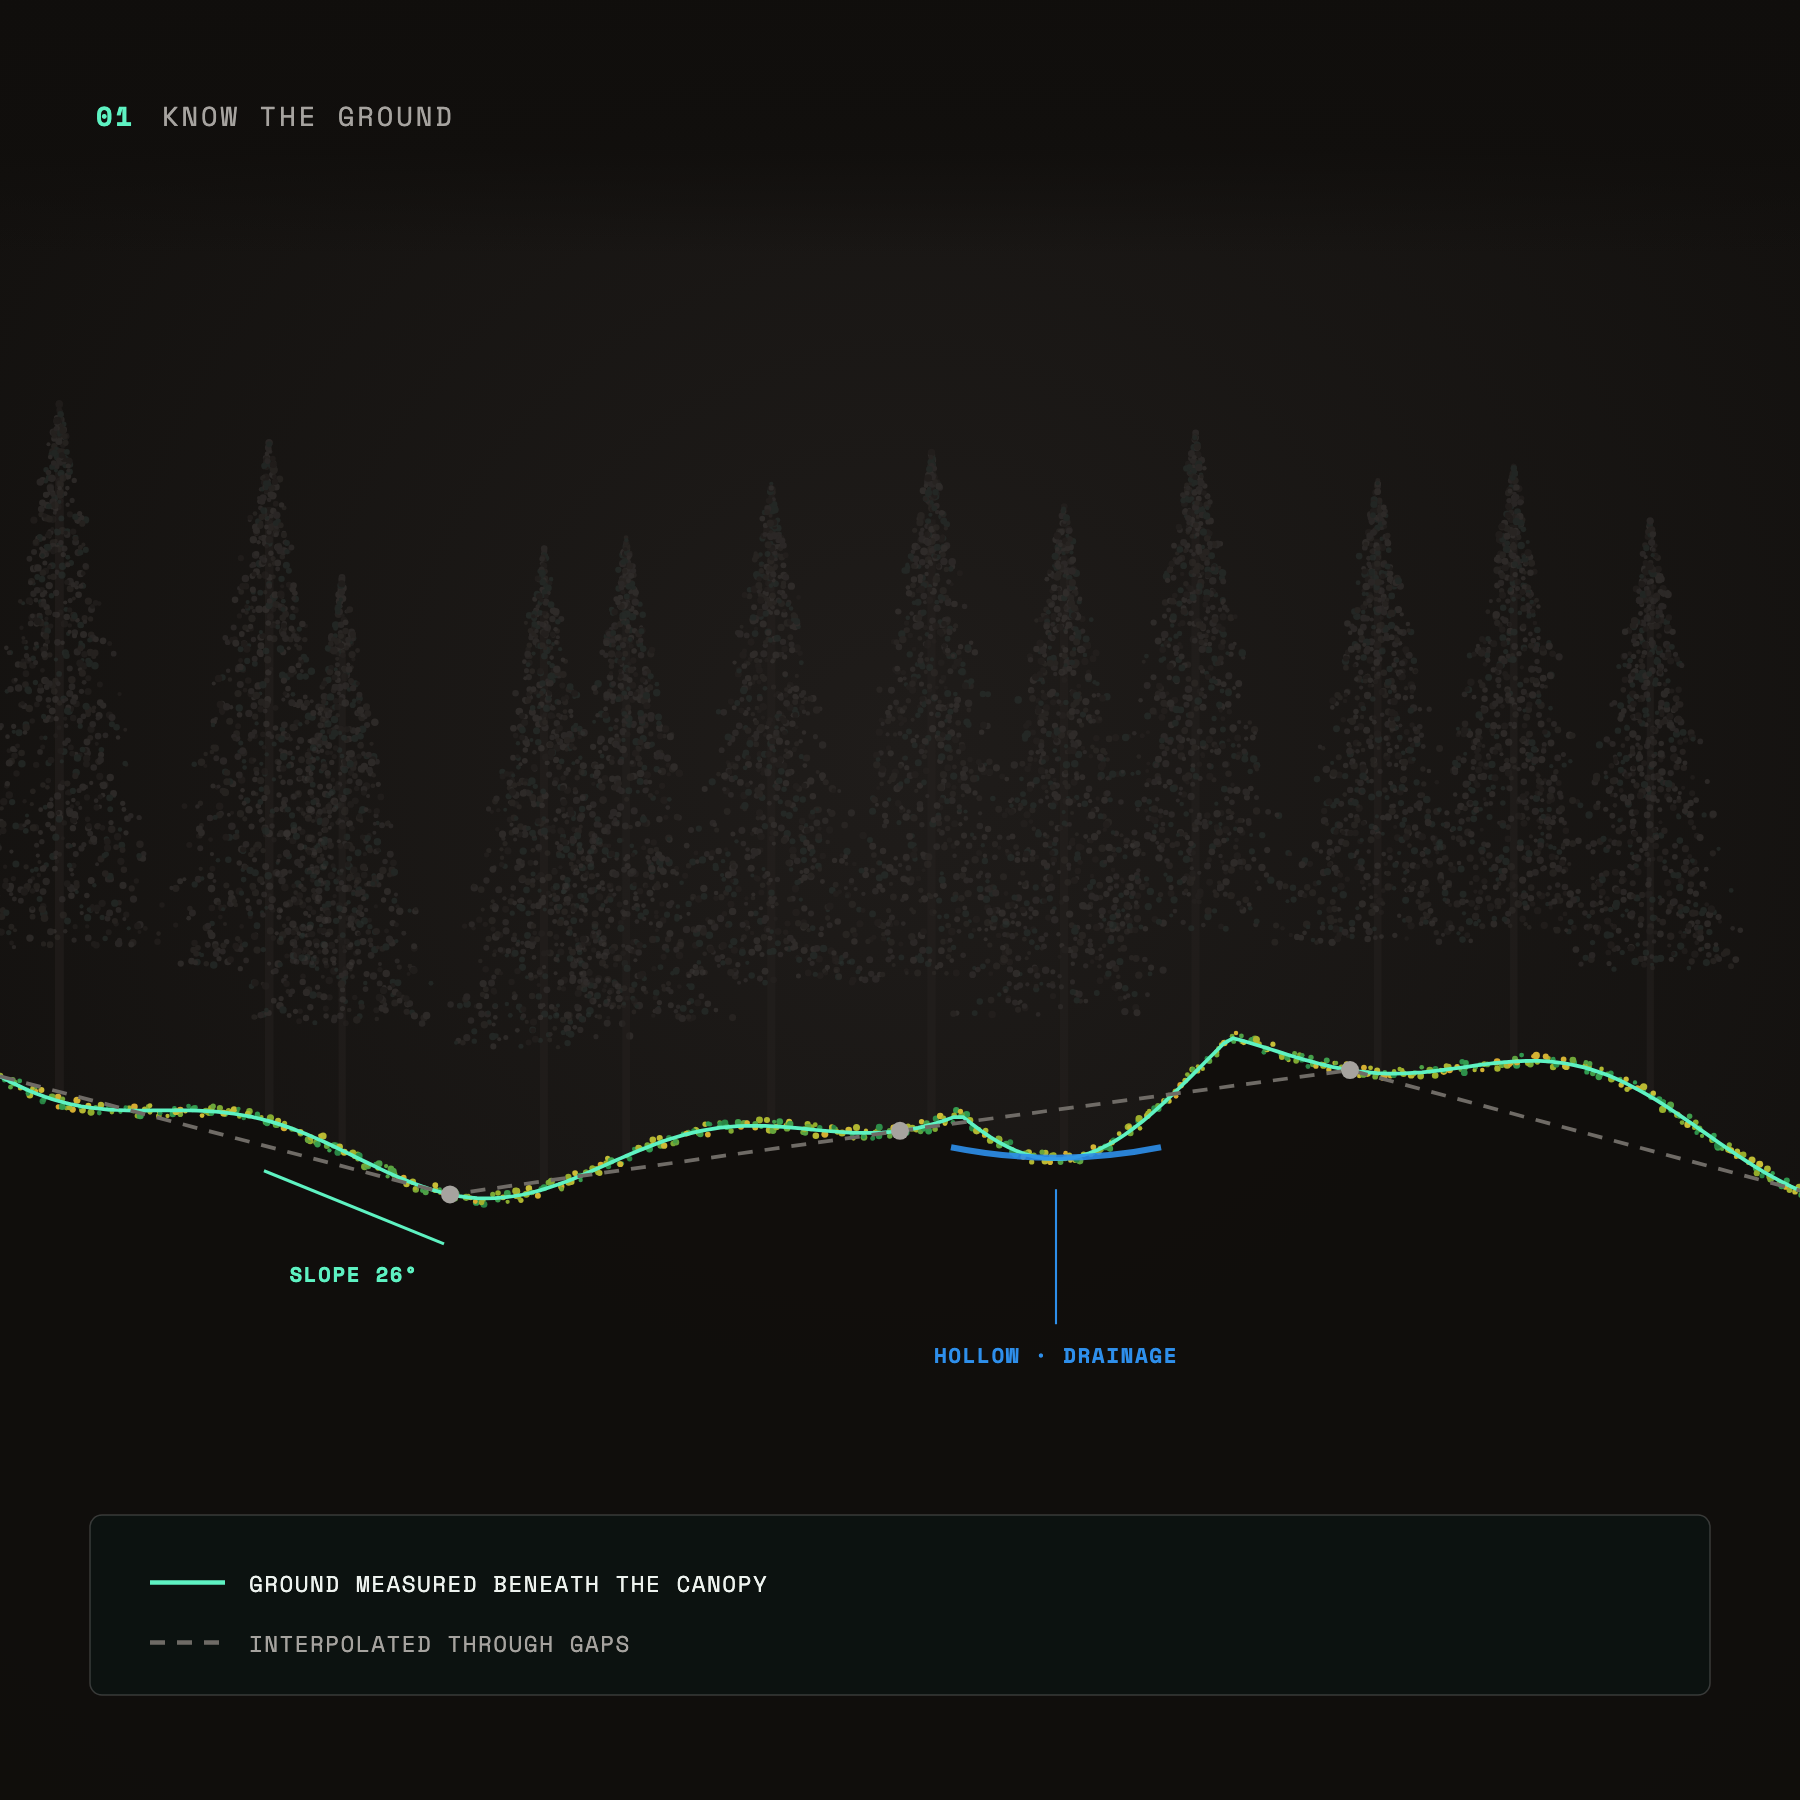
Know the ground: ground profile measured beneath the canopy, showing slope and a drainage hollow
Know the ground
Slopes, hollows and drainage under the canopy, measured rather than interpolated.
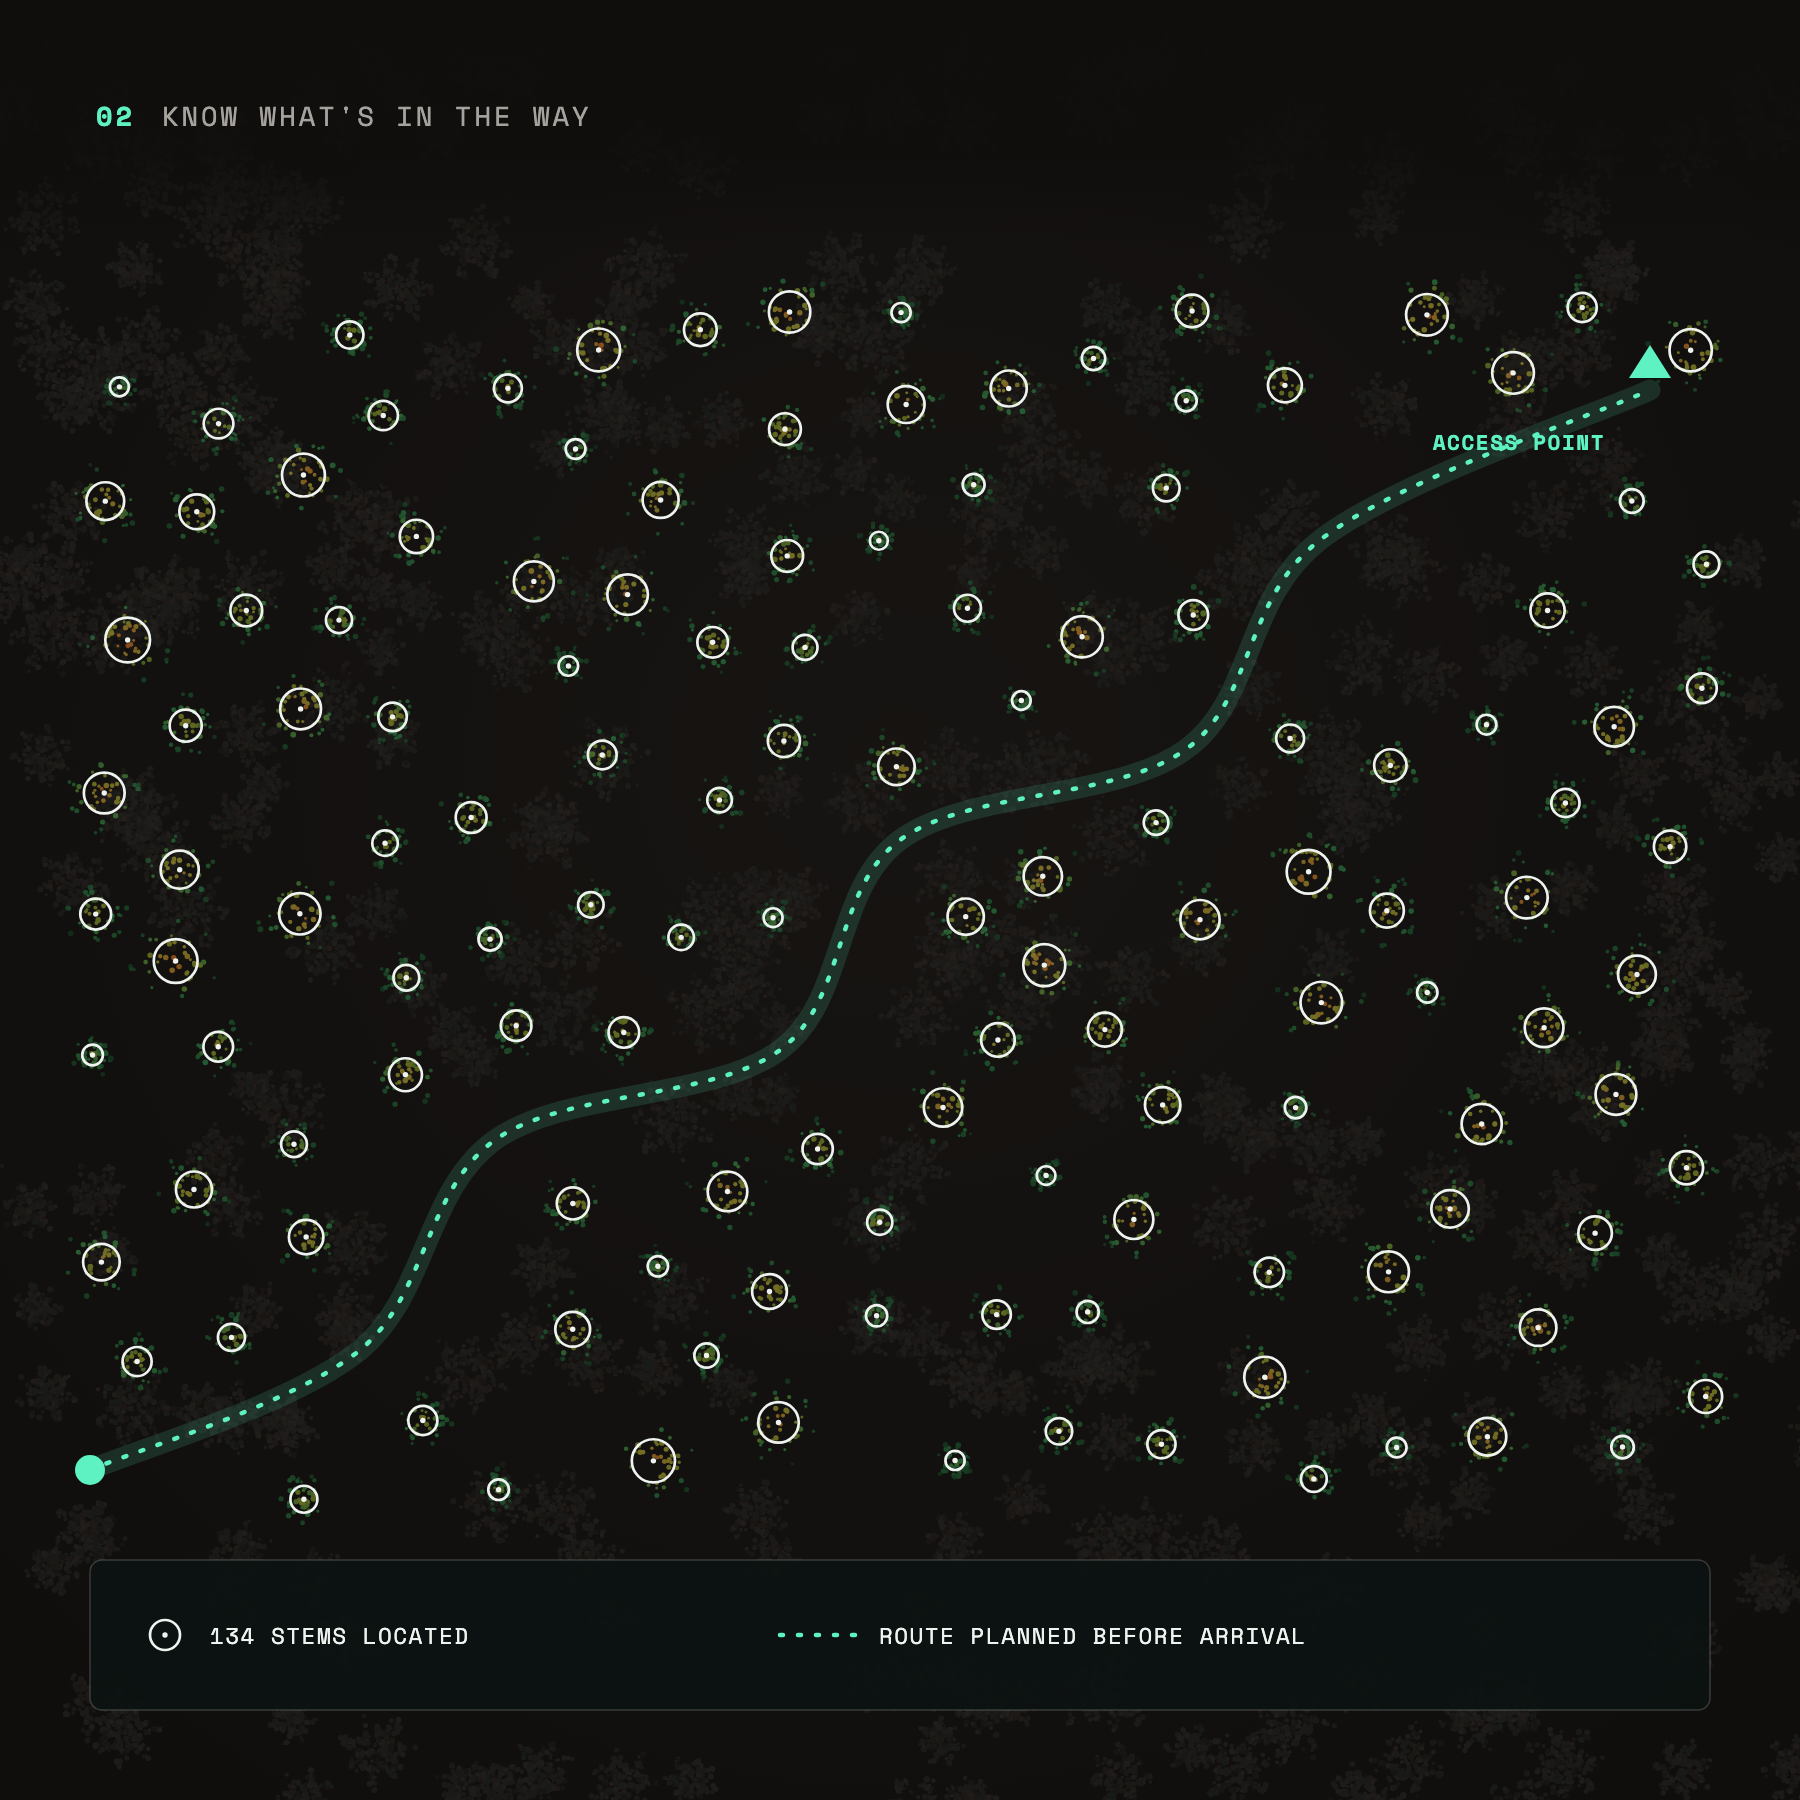
Know what's in the way: 134 tree stems located and an access route planned through them before arrival
Know what’s in the way
Every stem located, so routes and access are planned before anyone arrives.
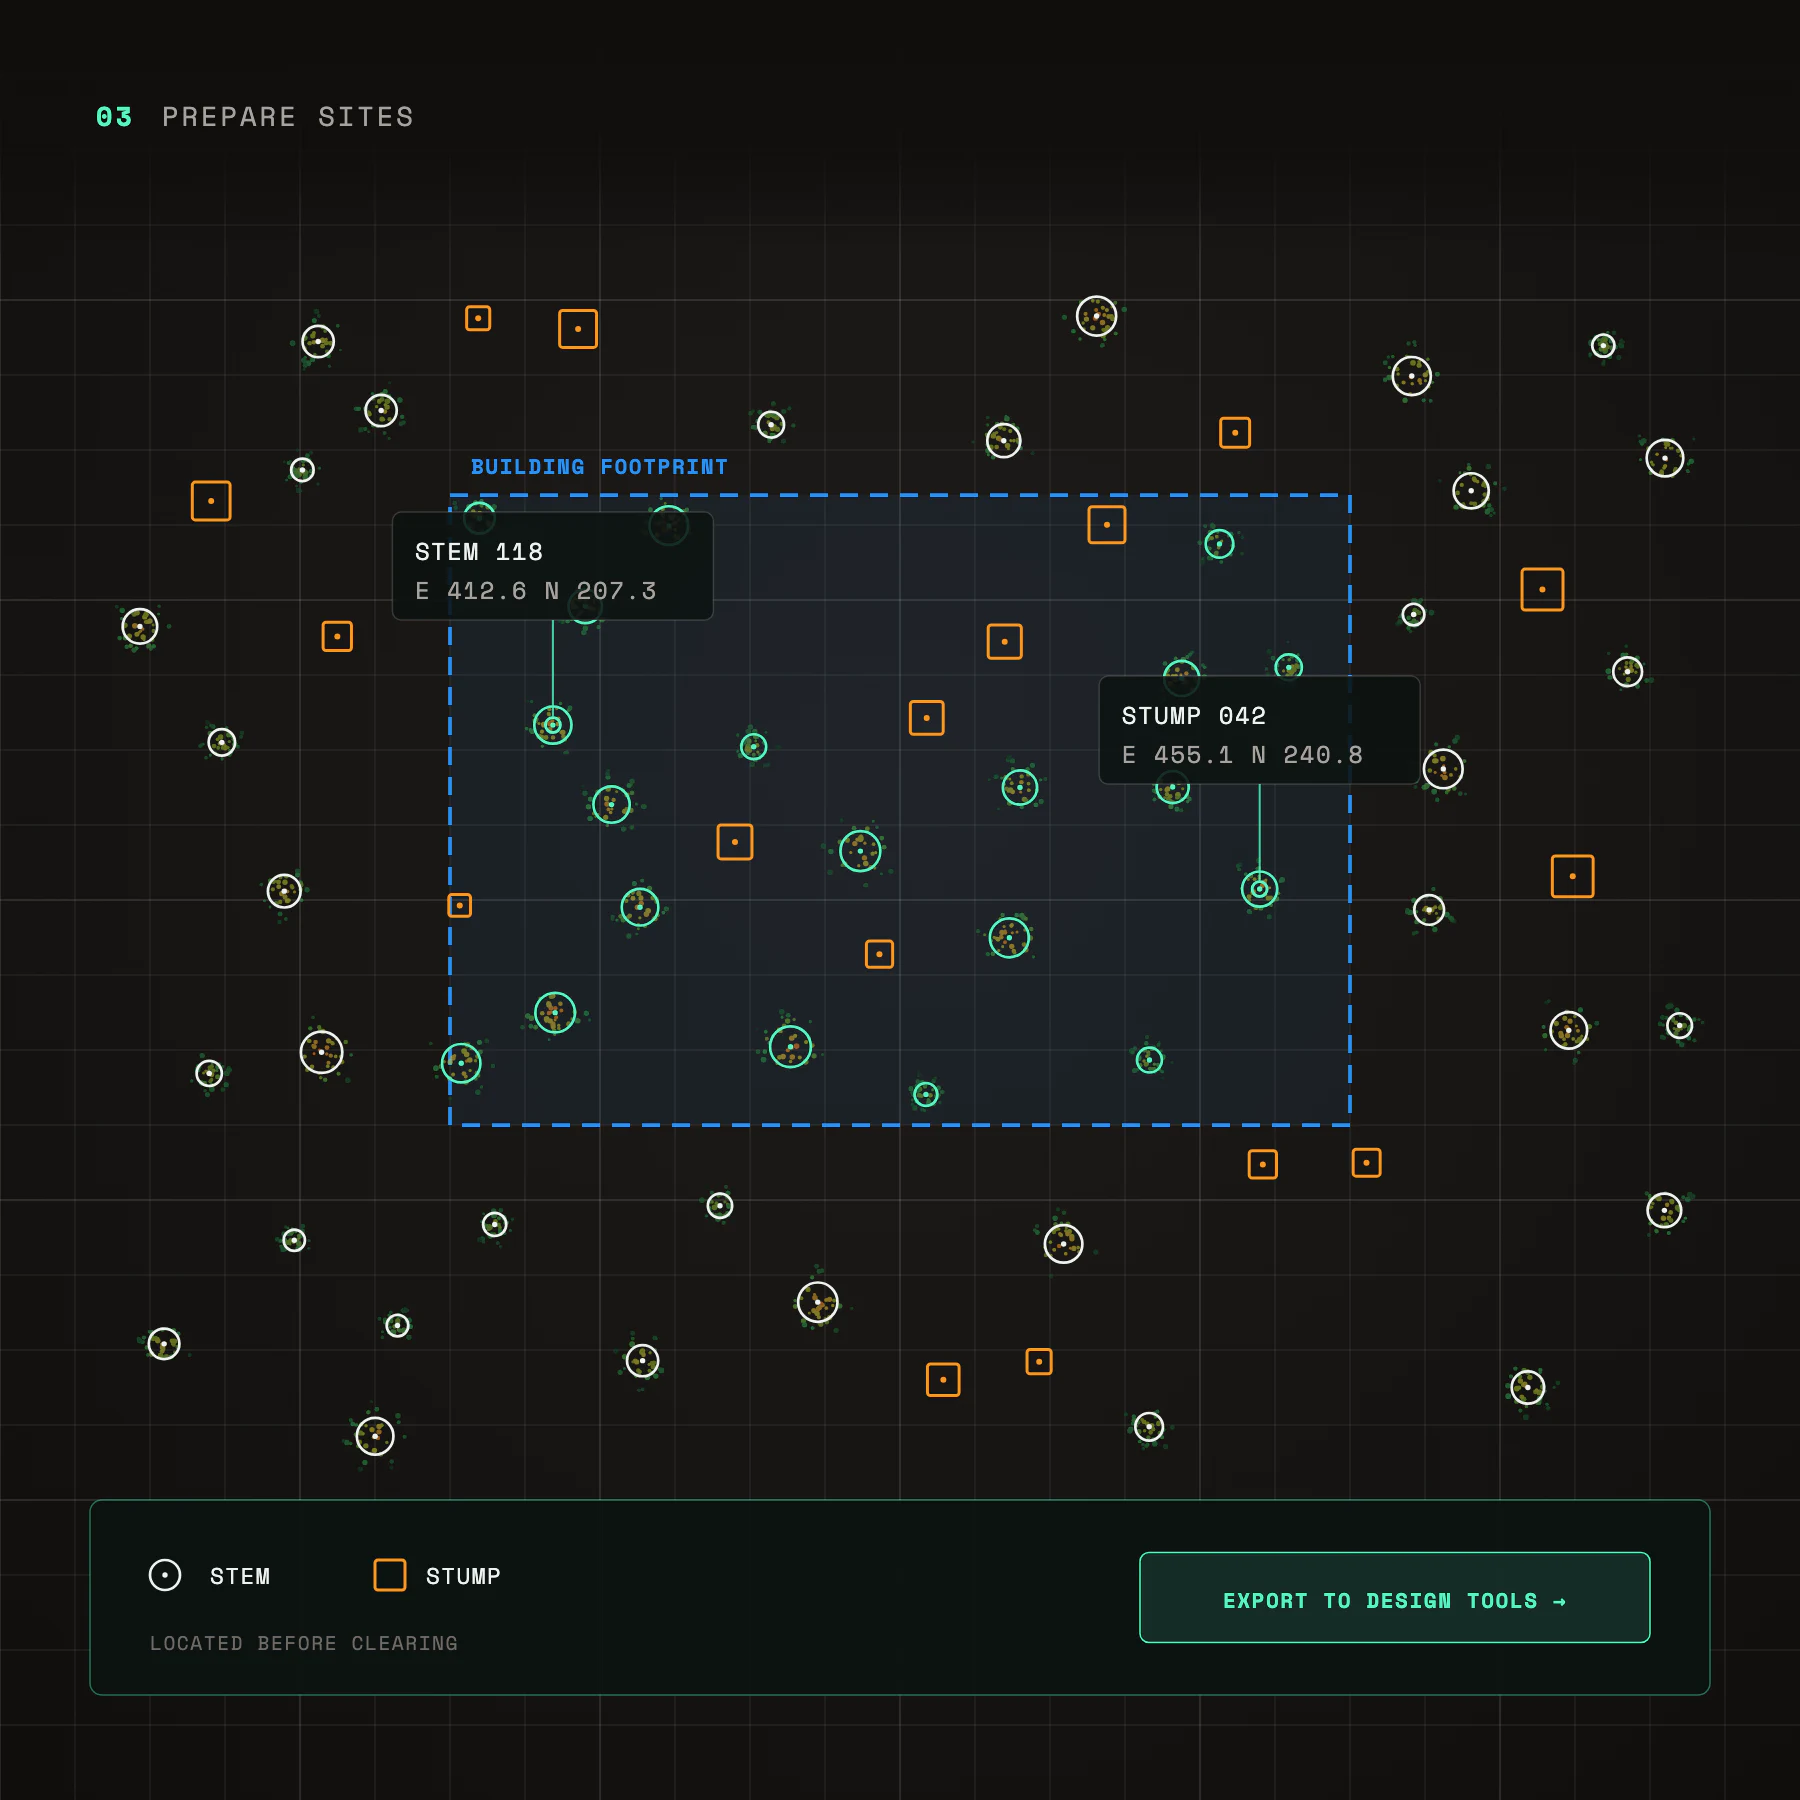
Prepare sites: stems and stumps located with coordinates inside a planned building footprint, ready to export to design tools
Prepare sites
Every stem and stump located before clearing, exported straight into design tools.
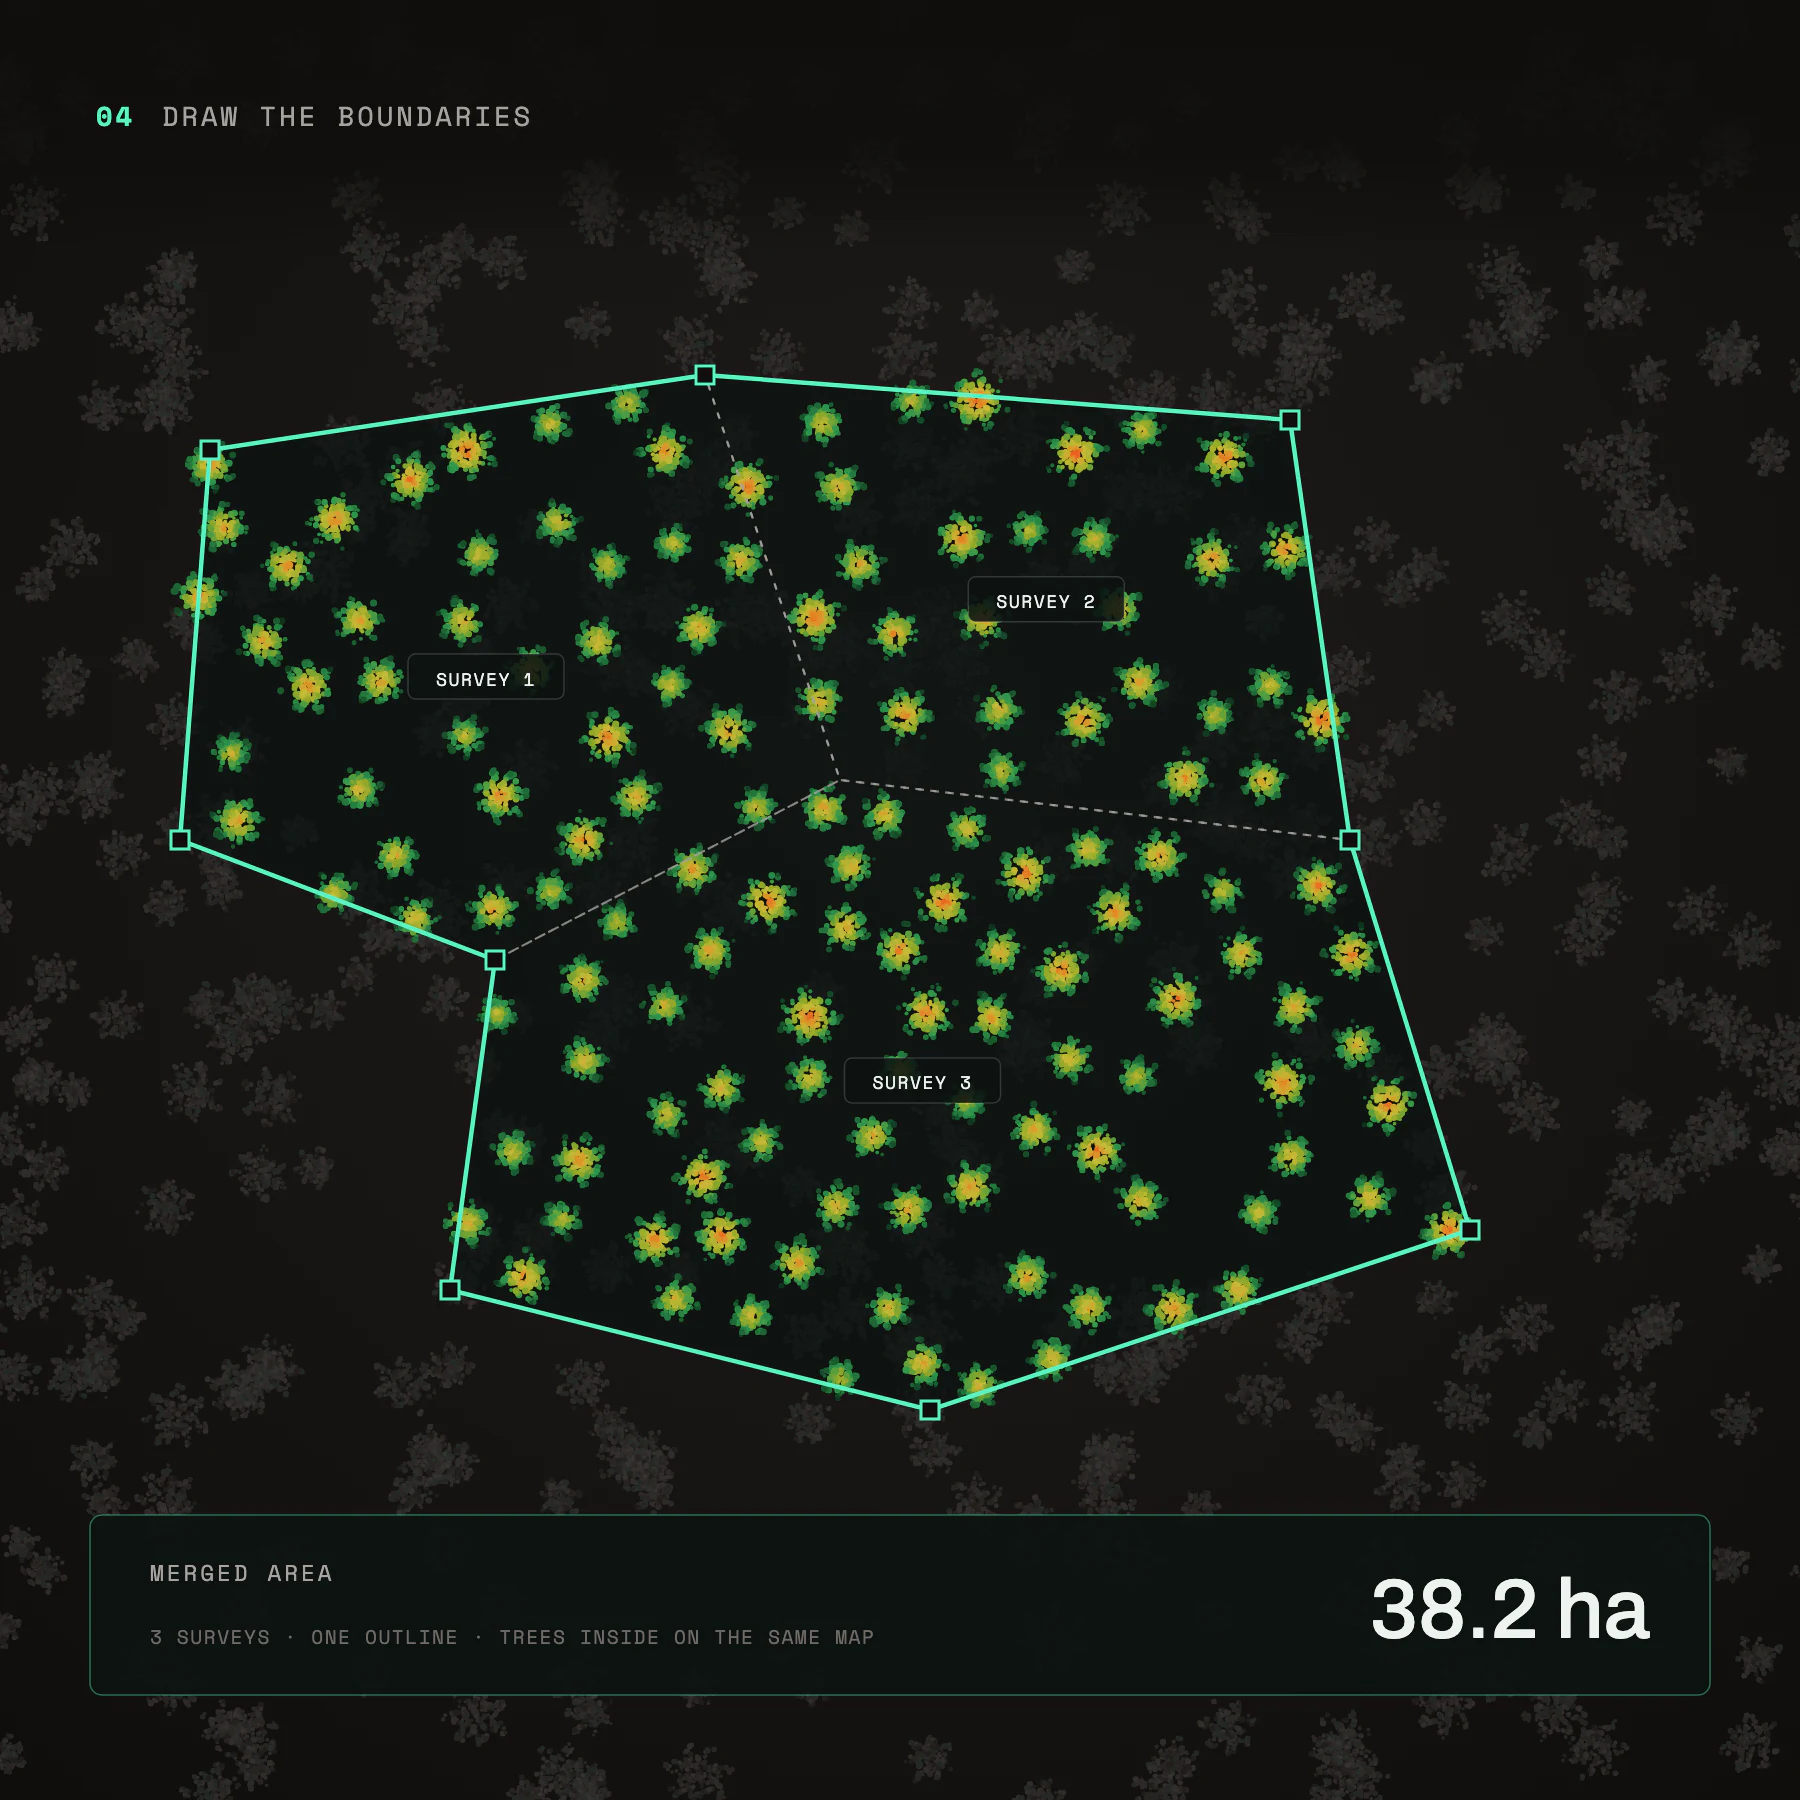
Draw the boundaries: three surveys merged into one 38.2 hectare outline with every tree on the same map
Draw the boundaries
Surveyed areas merged into one outline, on the same map as everything inside them.
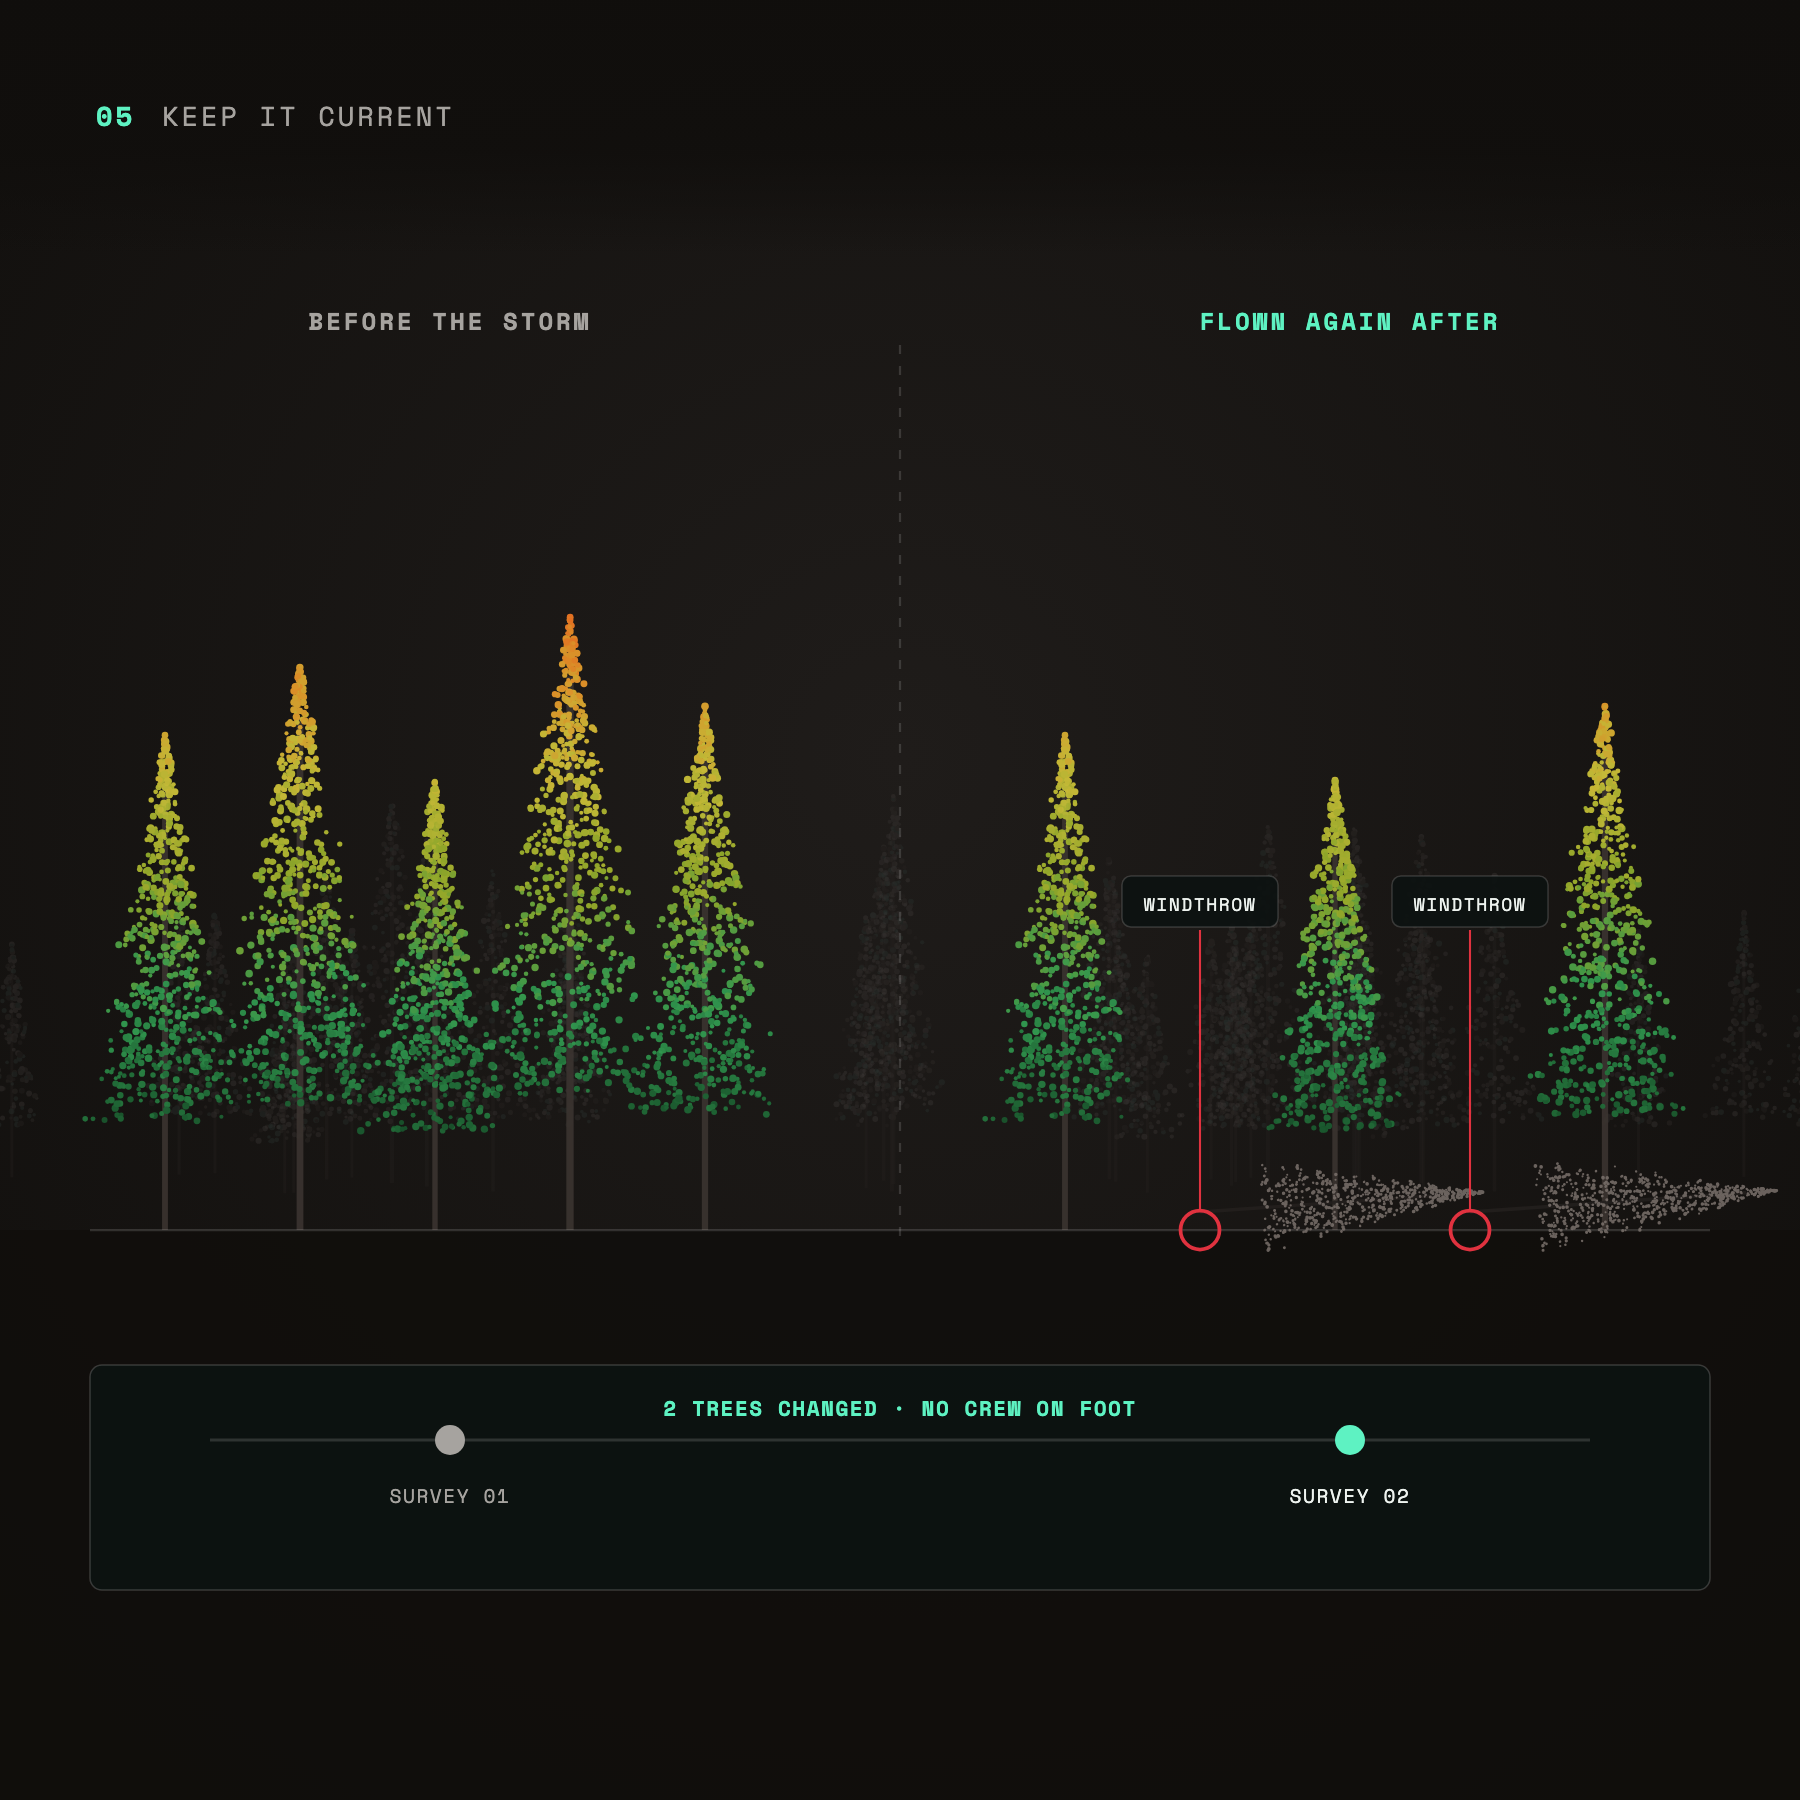
Keep it current: a stand surveyed before and after a storm, with two windthrown trees detected
Keep a timeline
Fly again after a storm or a season and see what changed, without crews on foot.
Keep people out of harm's way: one operator on safe ground while the drone surveys steep, hazardous slopes
Keep people out of harm’s way
On steep, hazardous or contested ground, the drone goes so people don’t have to.
get started now

Pick a site.
Leave with a terrain model you can trust.