Forest Inventory

Scroll to learn more
THE Problem

Most inventories are a sample dressed up as a census.

Sampled
A few plots stand in for the whole stand.
Crews calliper trees in a few plots and extrapolate. The trees between are never measured.
Estimated
Volume comes from a formula, not the tree.
An equation assumes an average stem. A tapered, curved or forked stem gets the same answer.
Seen from above
Airborne and satellite data stop at the crowns.
Top-down data maps the canopy well. The stems, where the timber value sits, are inferred.
Short-handed
The people who walk the plots are getting harder to find.
Skilled field foresters are scarce and expensive, so inventories get thinner, older or both.
Untraceable
Nobody can say where the plots were.
A forest plan gives a number, not its evidence. When an auditor asks, there's nothing to show.
Slow
By the time the numbers arrive, the decision has moved.
Weeks of fieldwork, months of compilation. One customer's old process took about four months.
From capture to value

Most inventories are a sample dressed up as a census.

The world first
‍end-to-end physical AI in Nature

What you receive

For every single tree,
and for the whole stand.

For every single tree
Position
Exact location and ground elevation.
DBH
Diameter at breast height value for every stem
Height
Measured from the ground model to the top.
Stem curve
Diameter every 10 cm up the trunk.
Volume
Measured from The 3d replica of the tree.
Species
Spruce, pine, birch trained out of the box.
For The whole stand
Tree count
Total, and trees per hectare.
Basal area
Per hectare: how fully stocked the forest is.
Timber volume
Per hectare and in total.
Timeline
Changes can be compared over time.
Species mix
Share of trees and volume by species.
Terrain model
The ground at 0.5 m resolution.
Outcomes

For every single tree,
and for the whole stand.

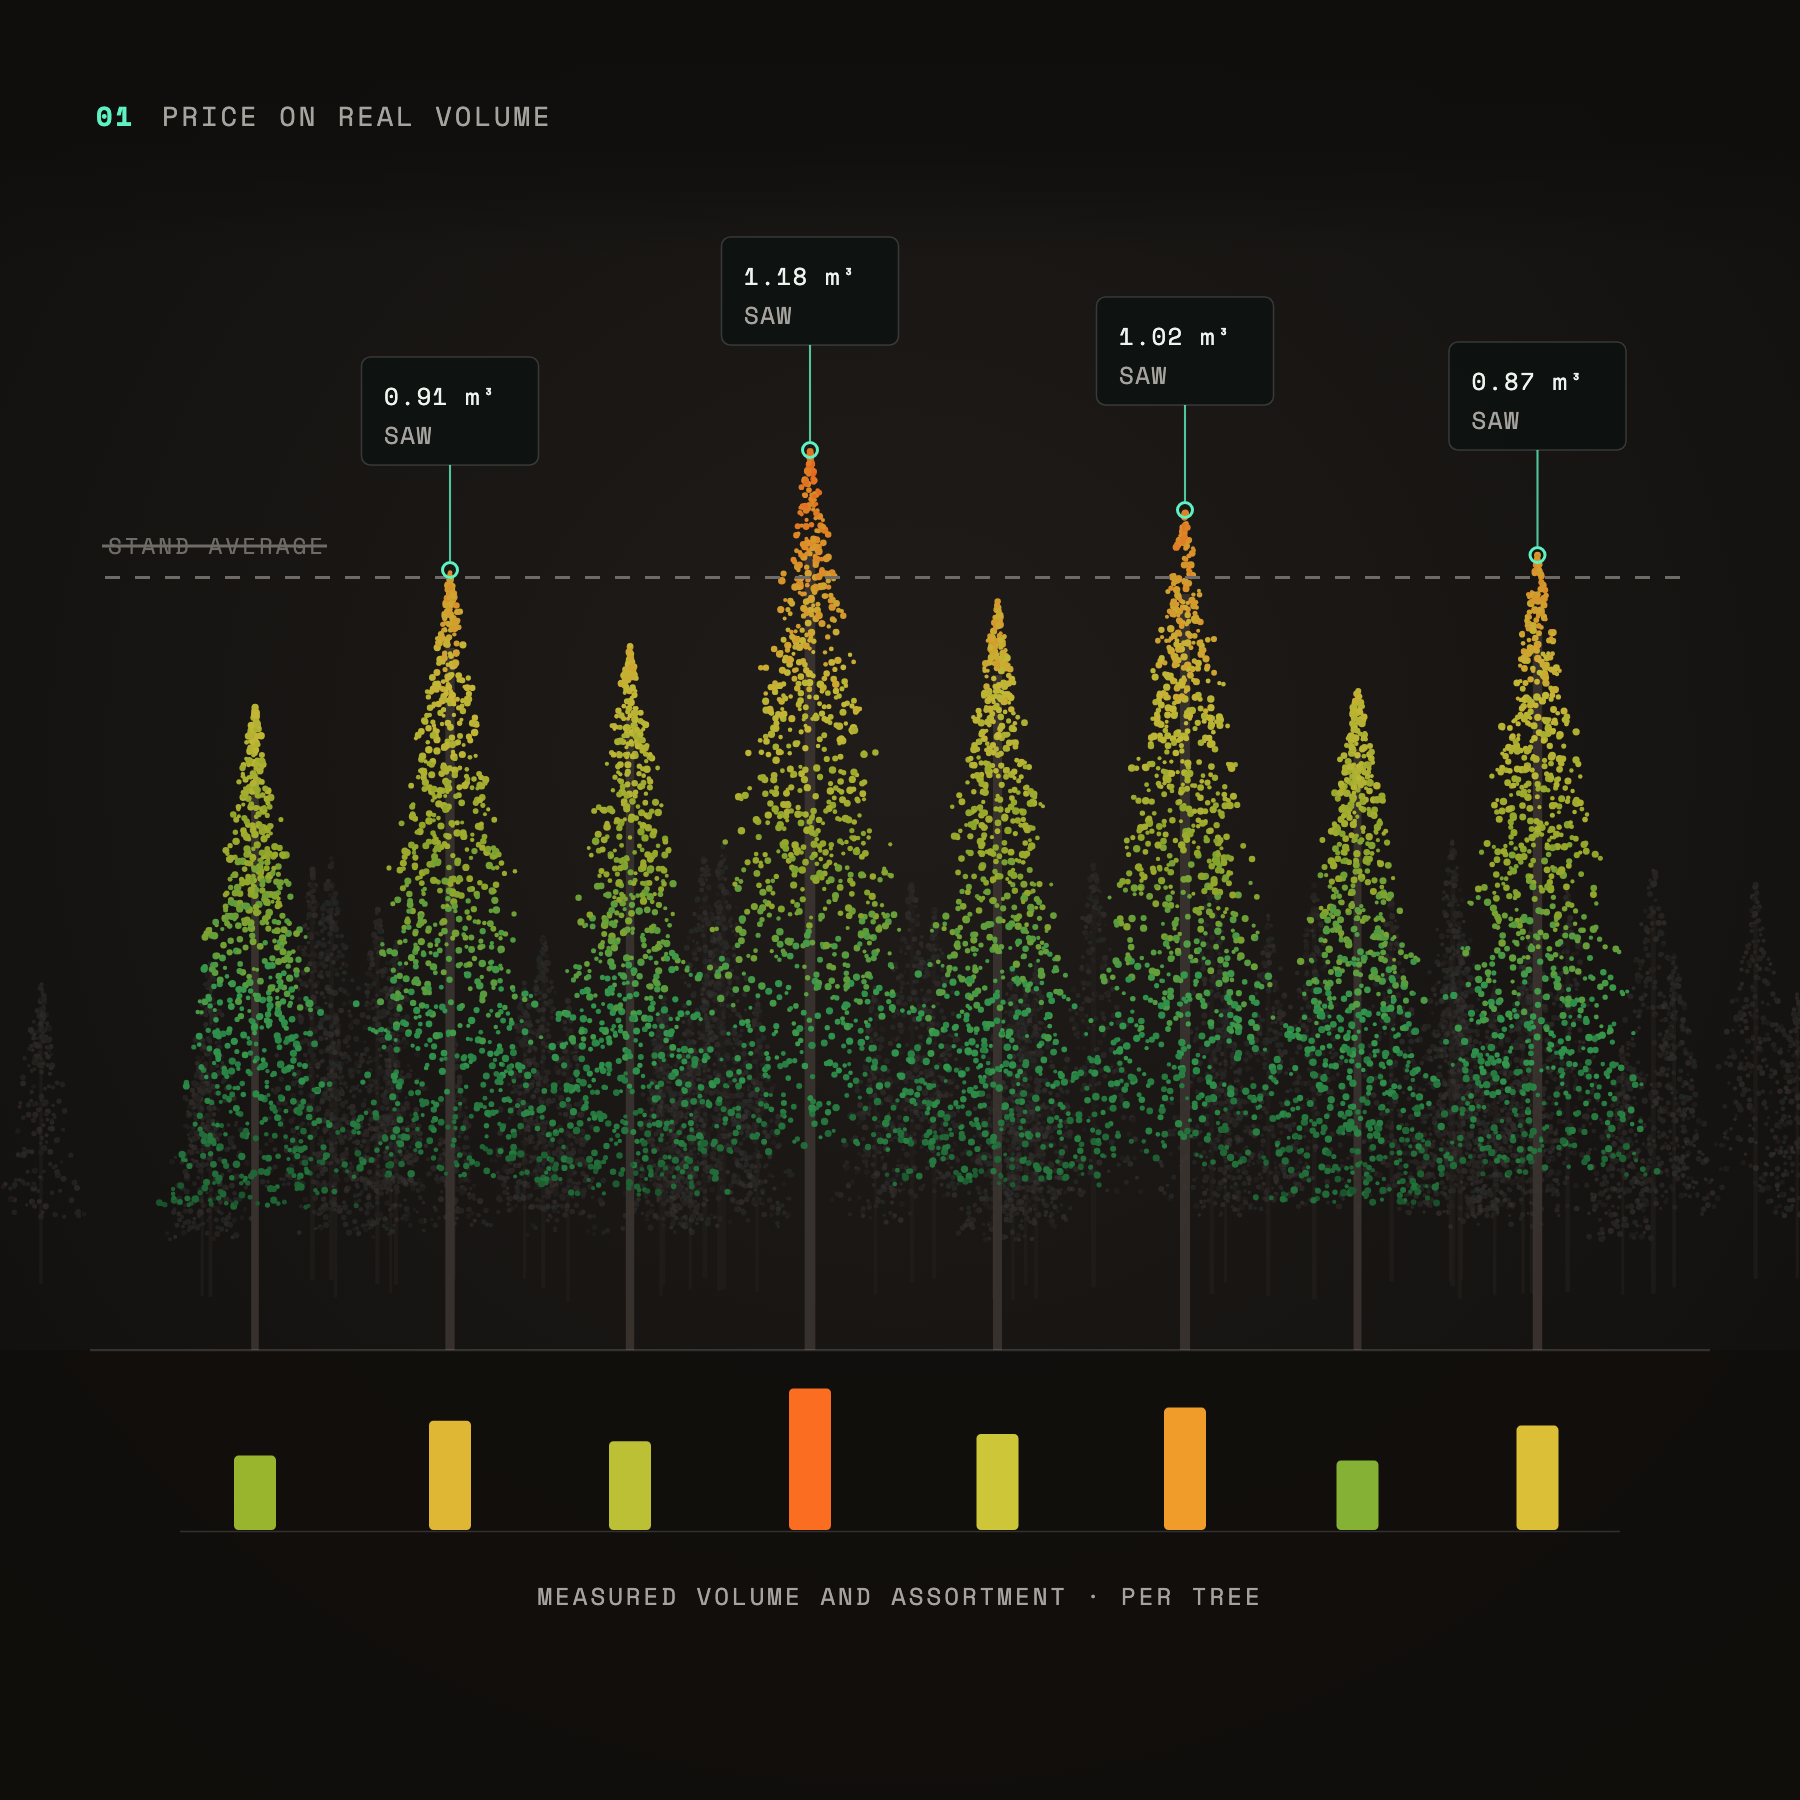
Price on real volume: point-cloud trees with measured sawlog volume per tree compared to the stand average
Price on real volume
Sell by measured volume and assortment, not a stand average.
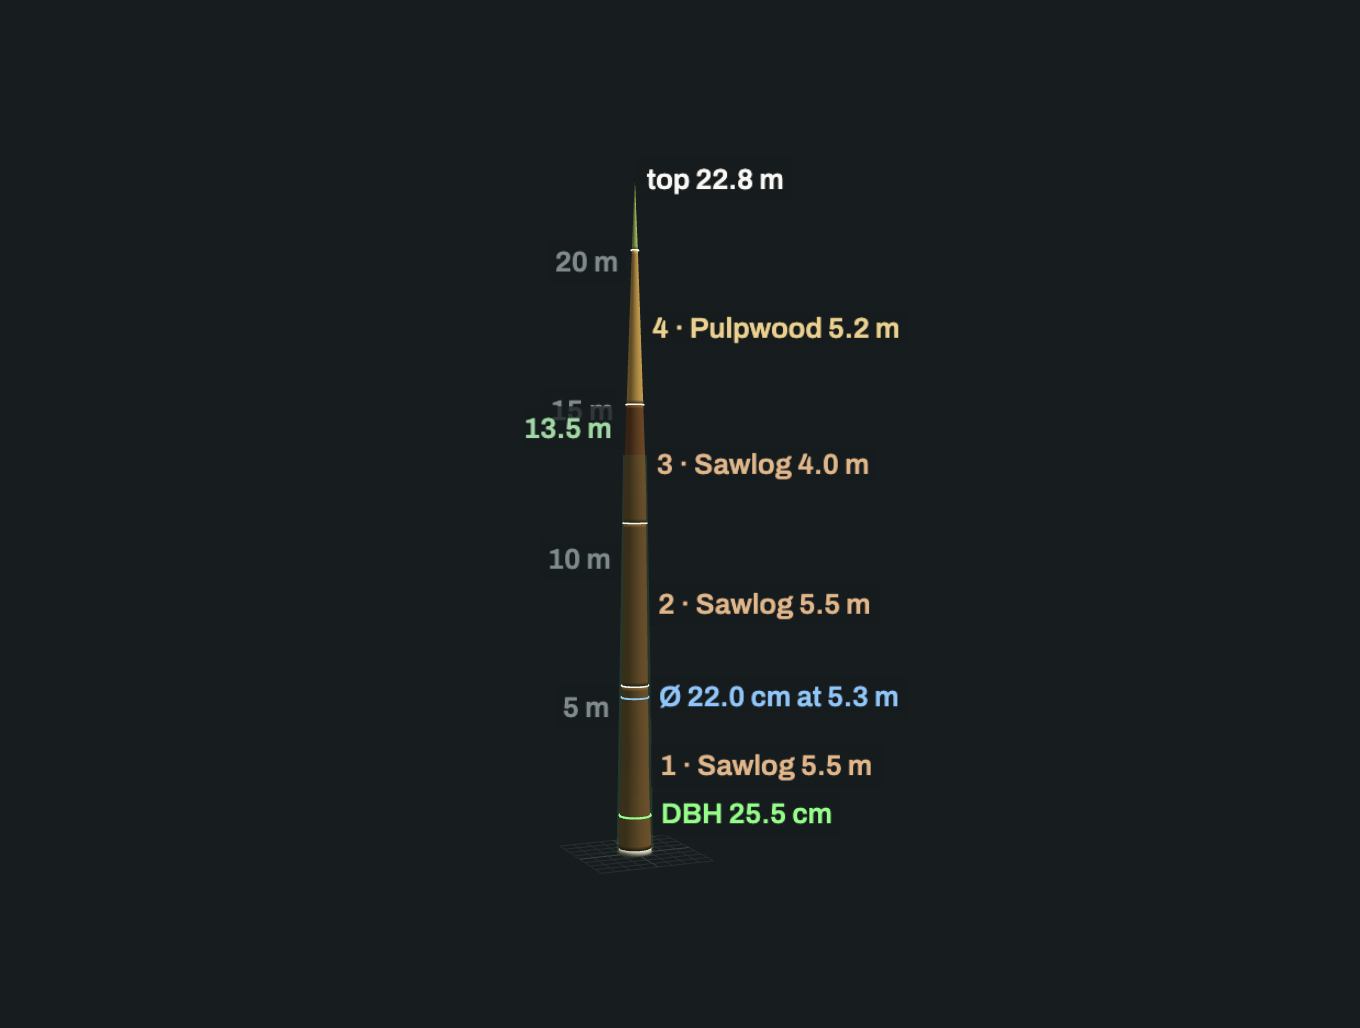
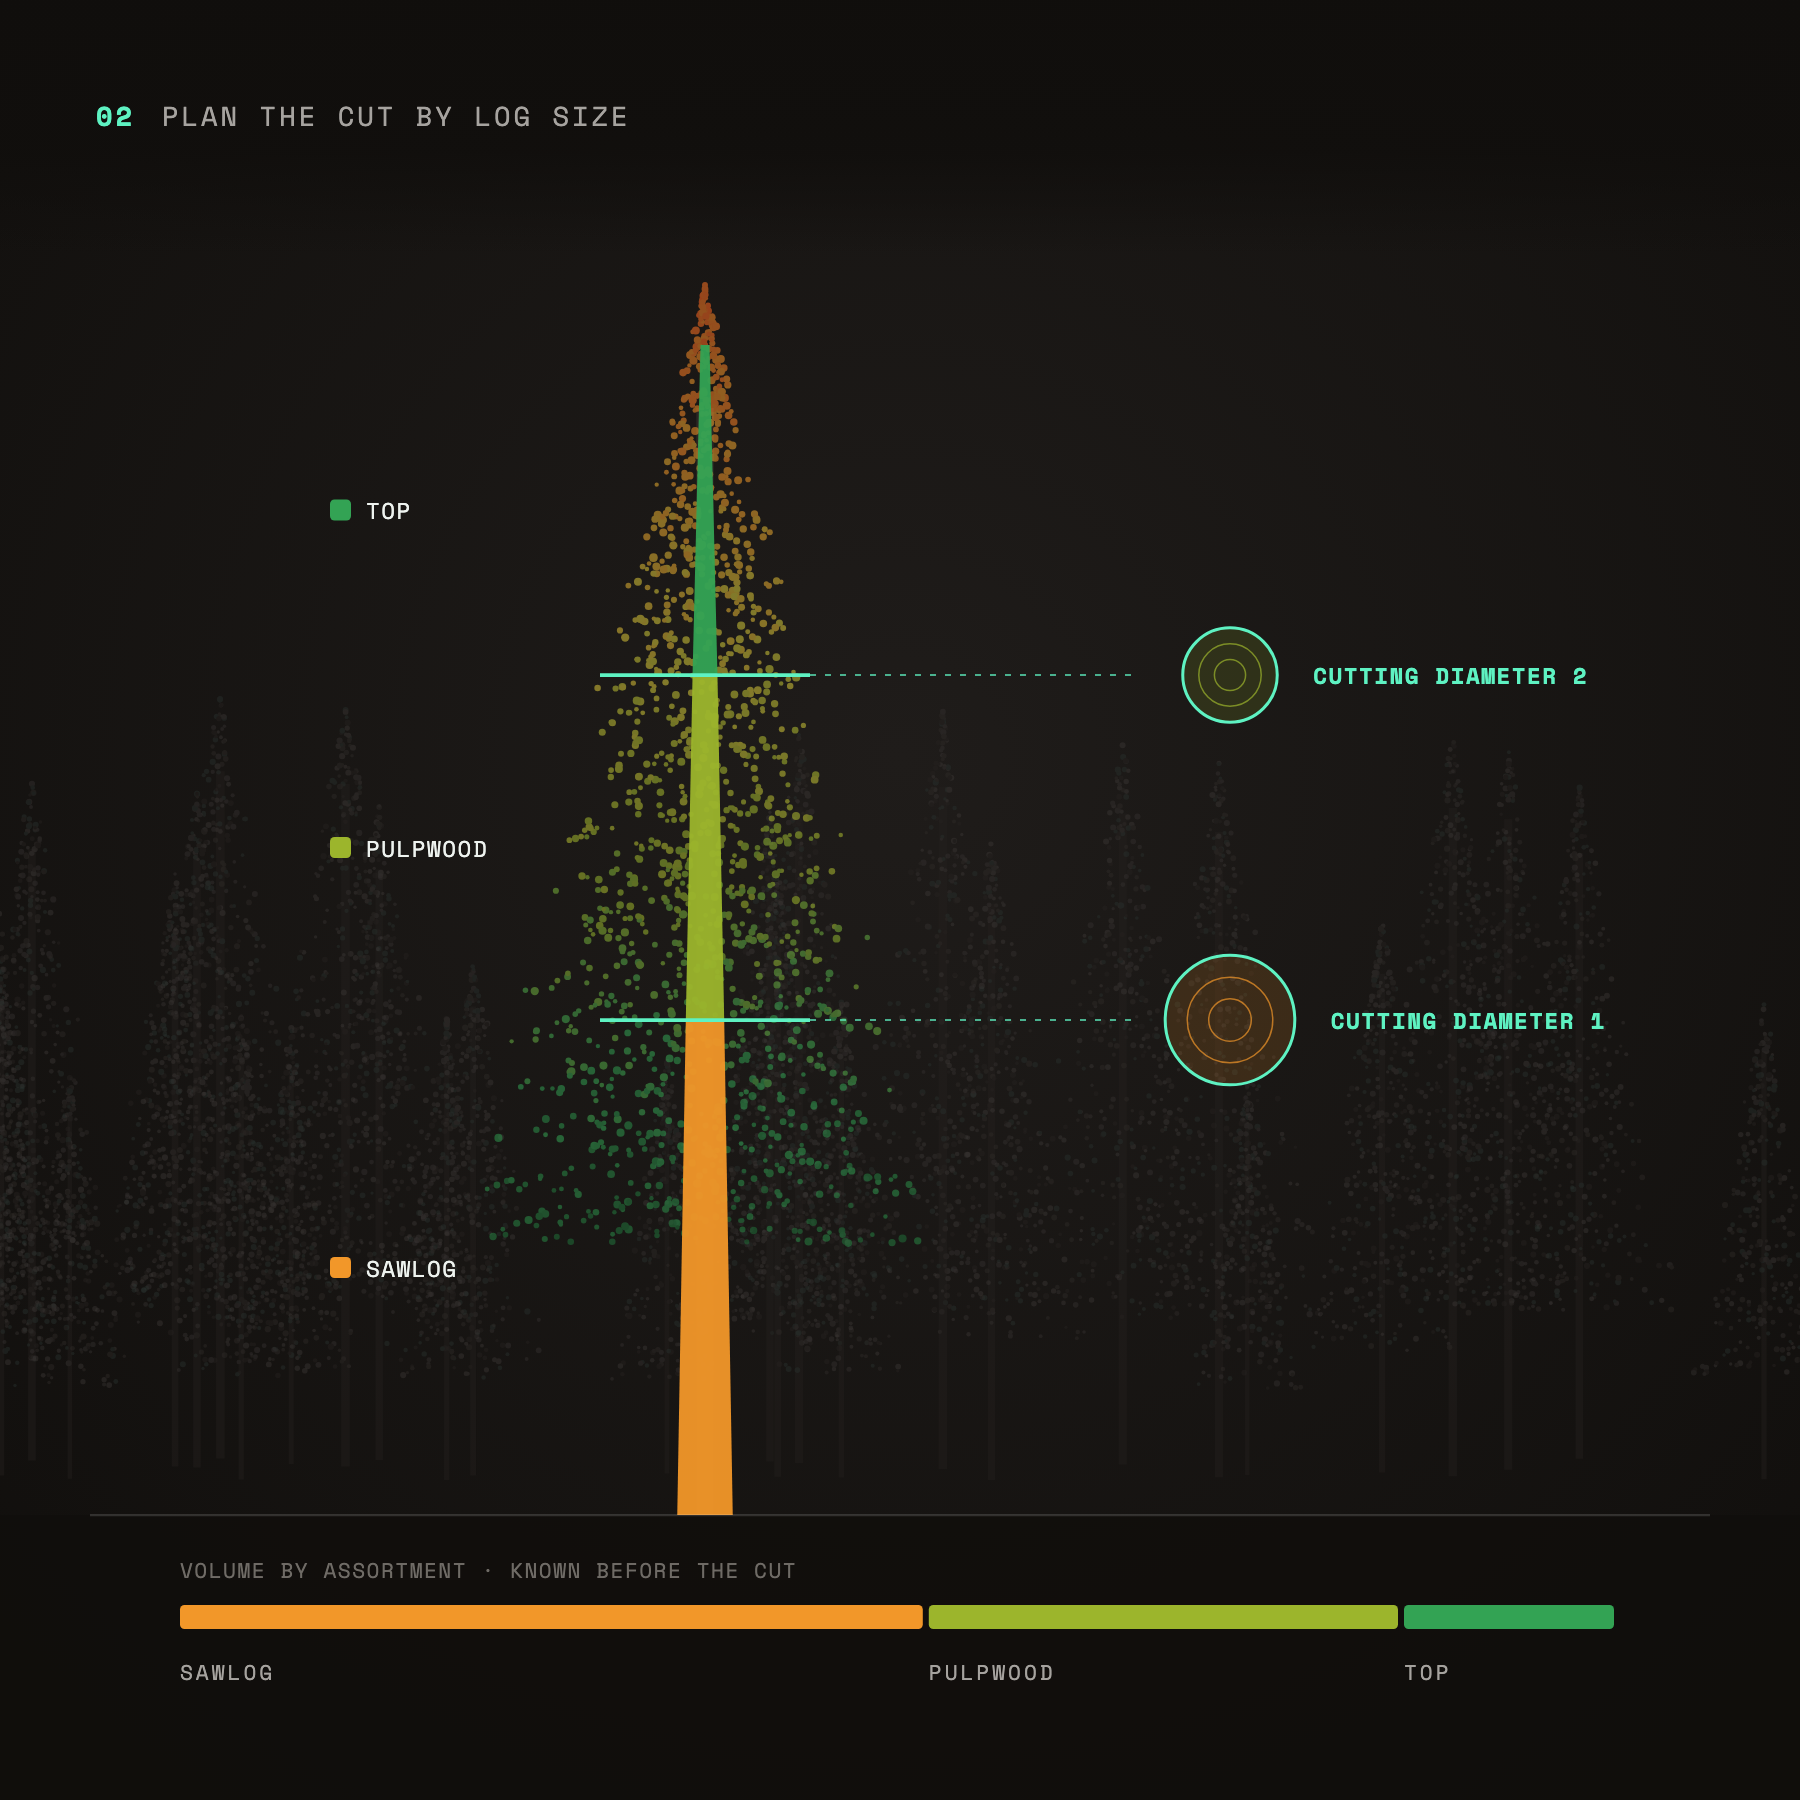
Plan the cut by log size: one tree split into sawlog, pulpwood and top sections with cutting diameters, known before harvest
Plan the cut by log size
Know the timber above each cutting diameter before a machine goes in.
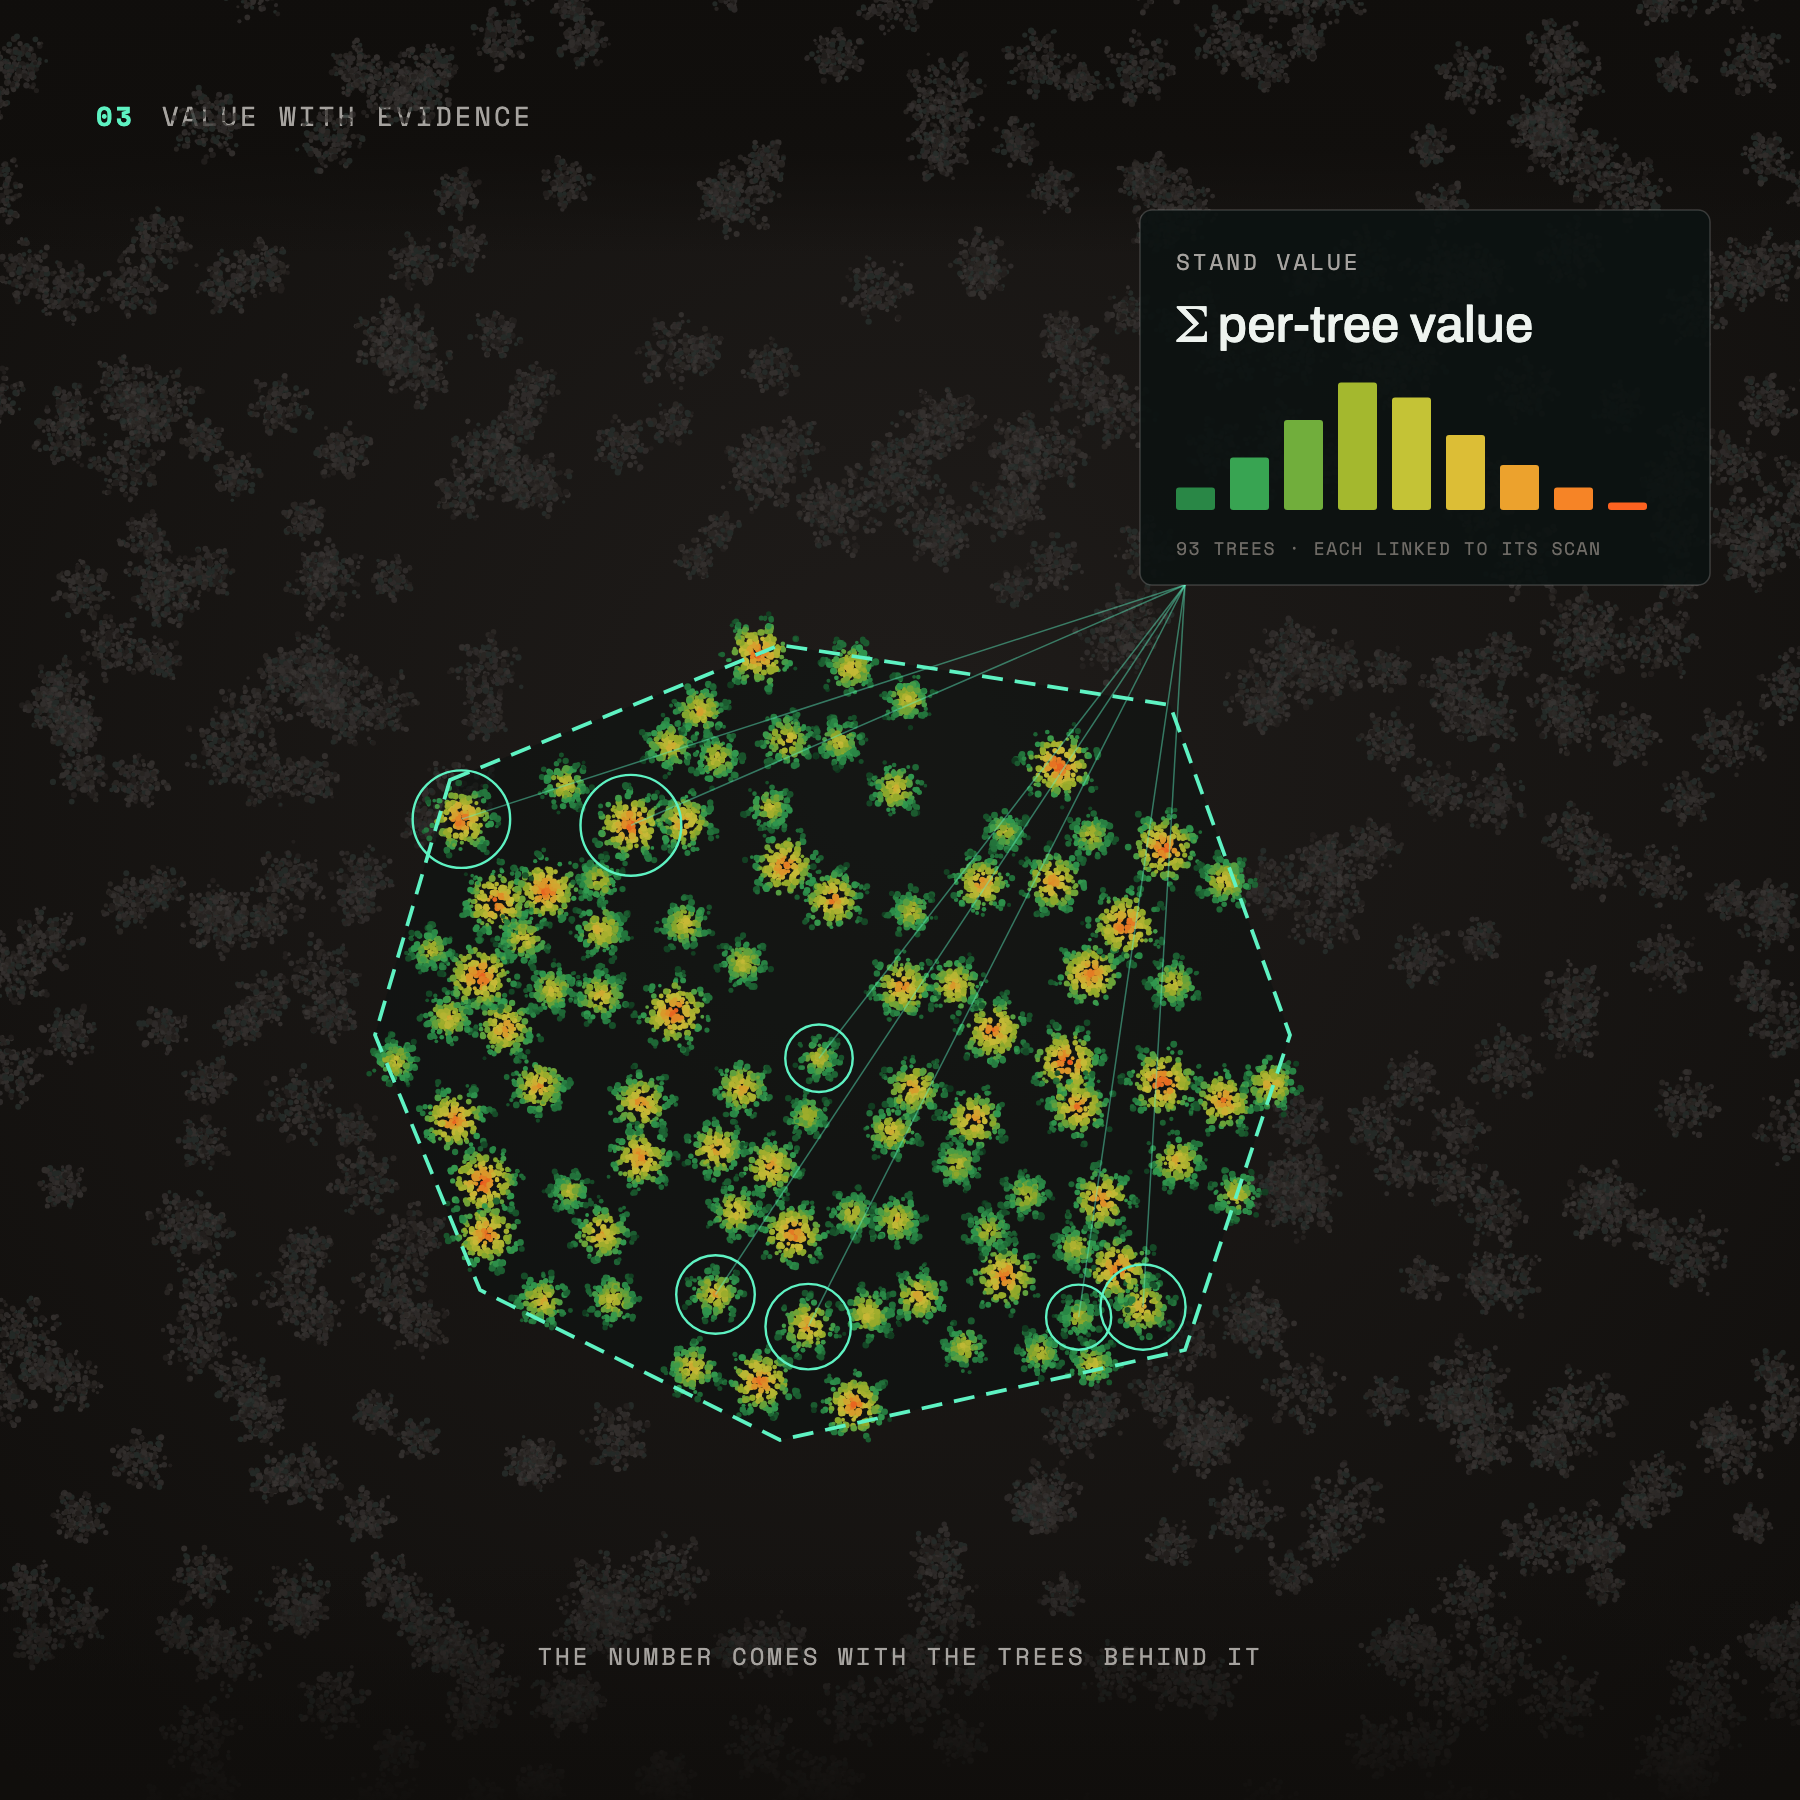
Value with evidence: stand value summed from per-tree values, each tree linked to its scan
Value with evidence
Every valuation comes with the trees behind it.
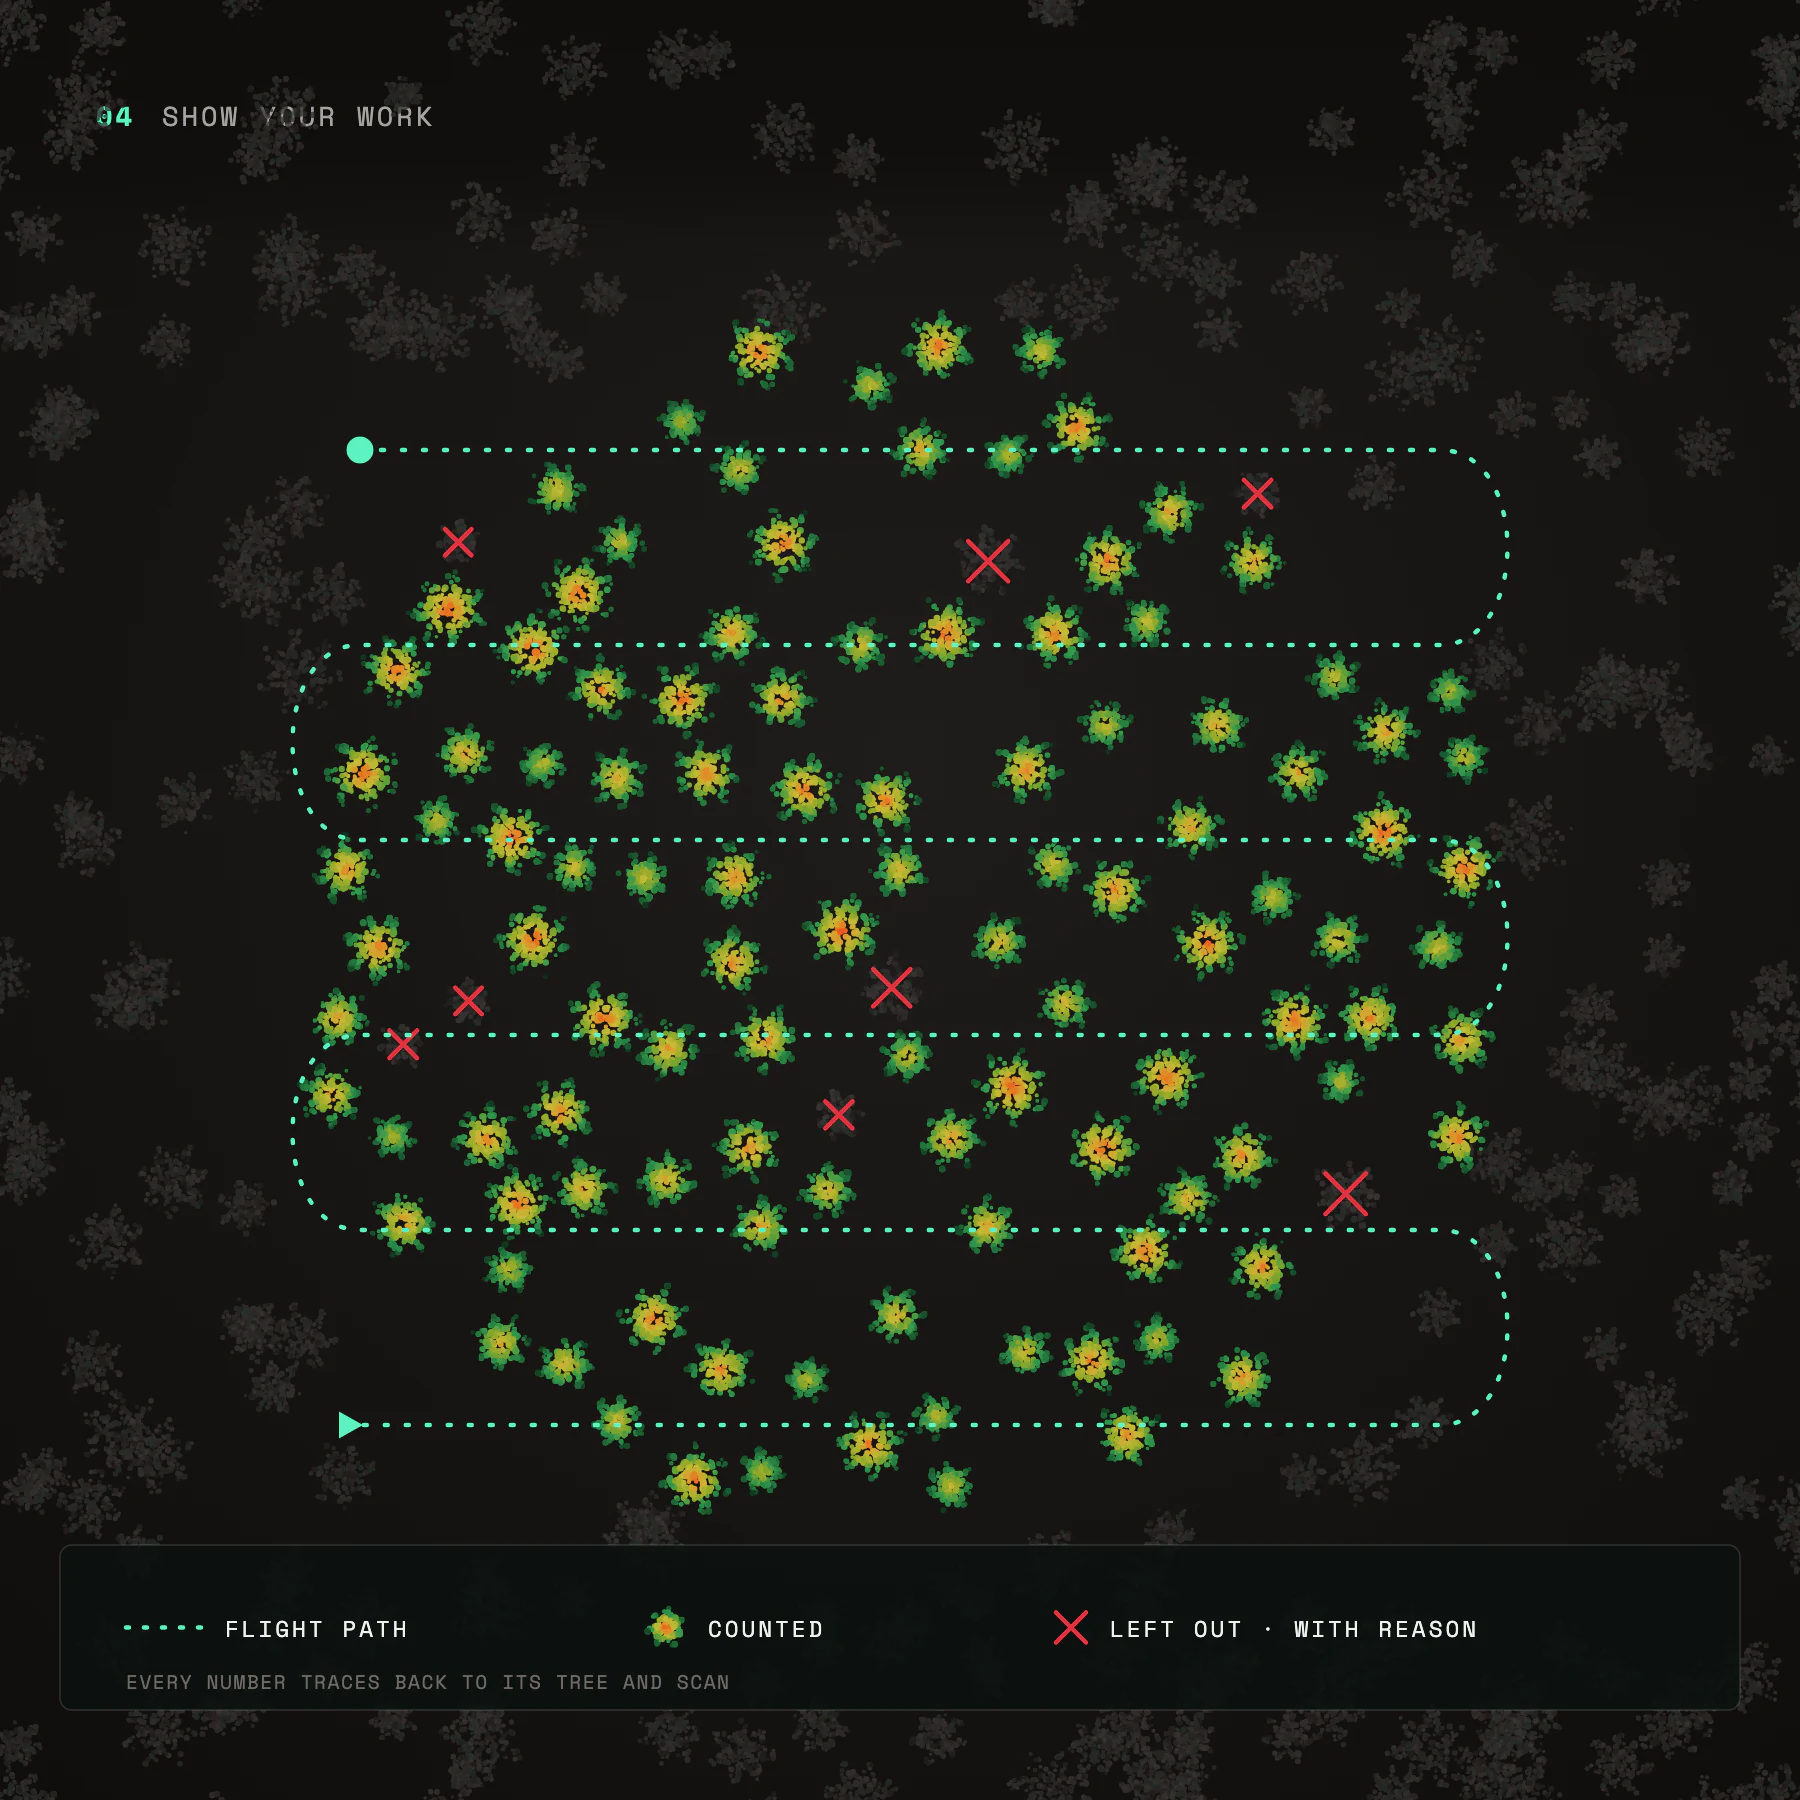
Show your work: drone flight path over a stand with counted trees and excluded trees marked with reasons
Show your work
Every number traces back to its tree and scan.
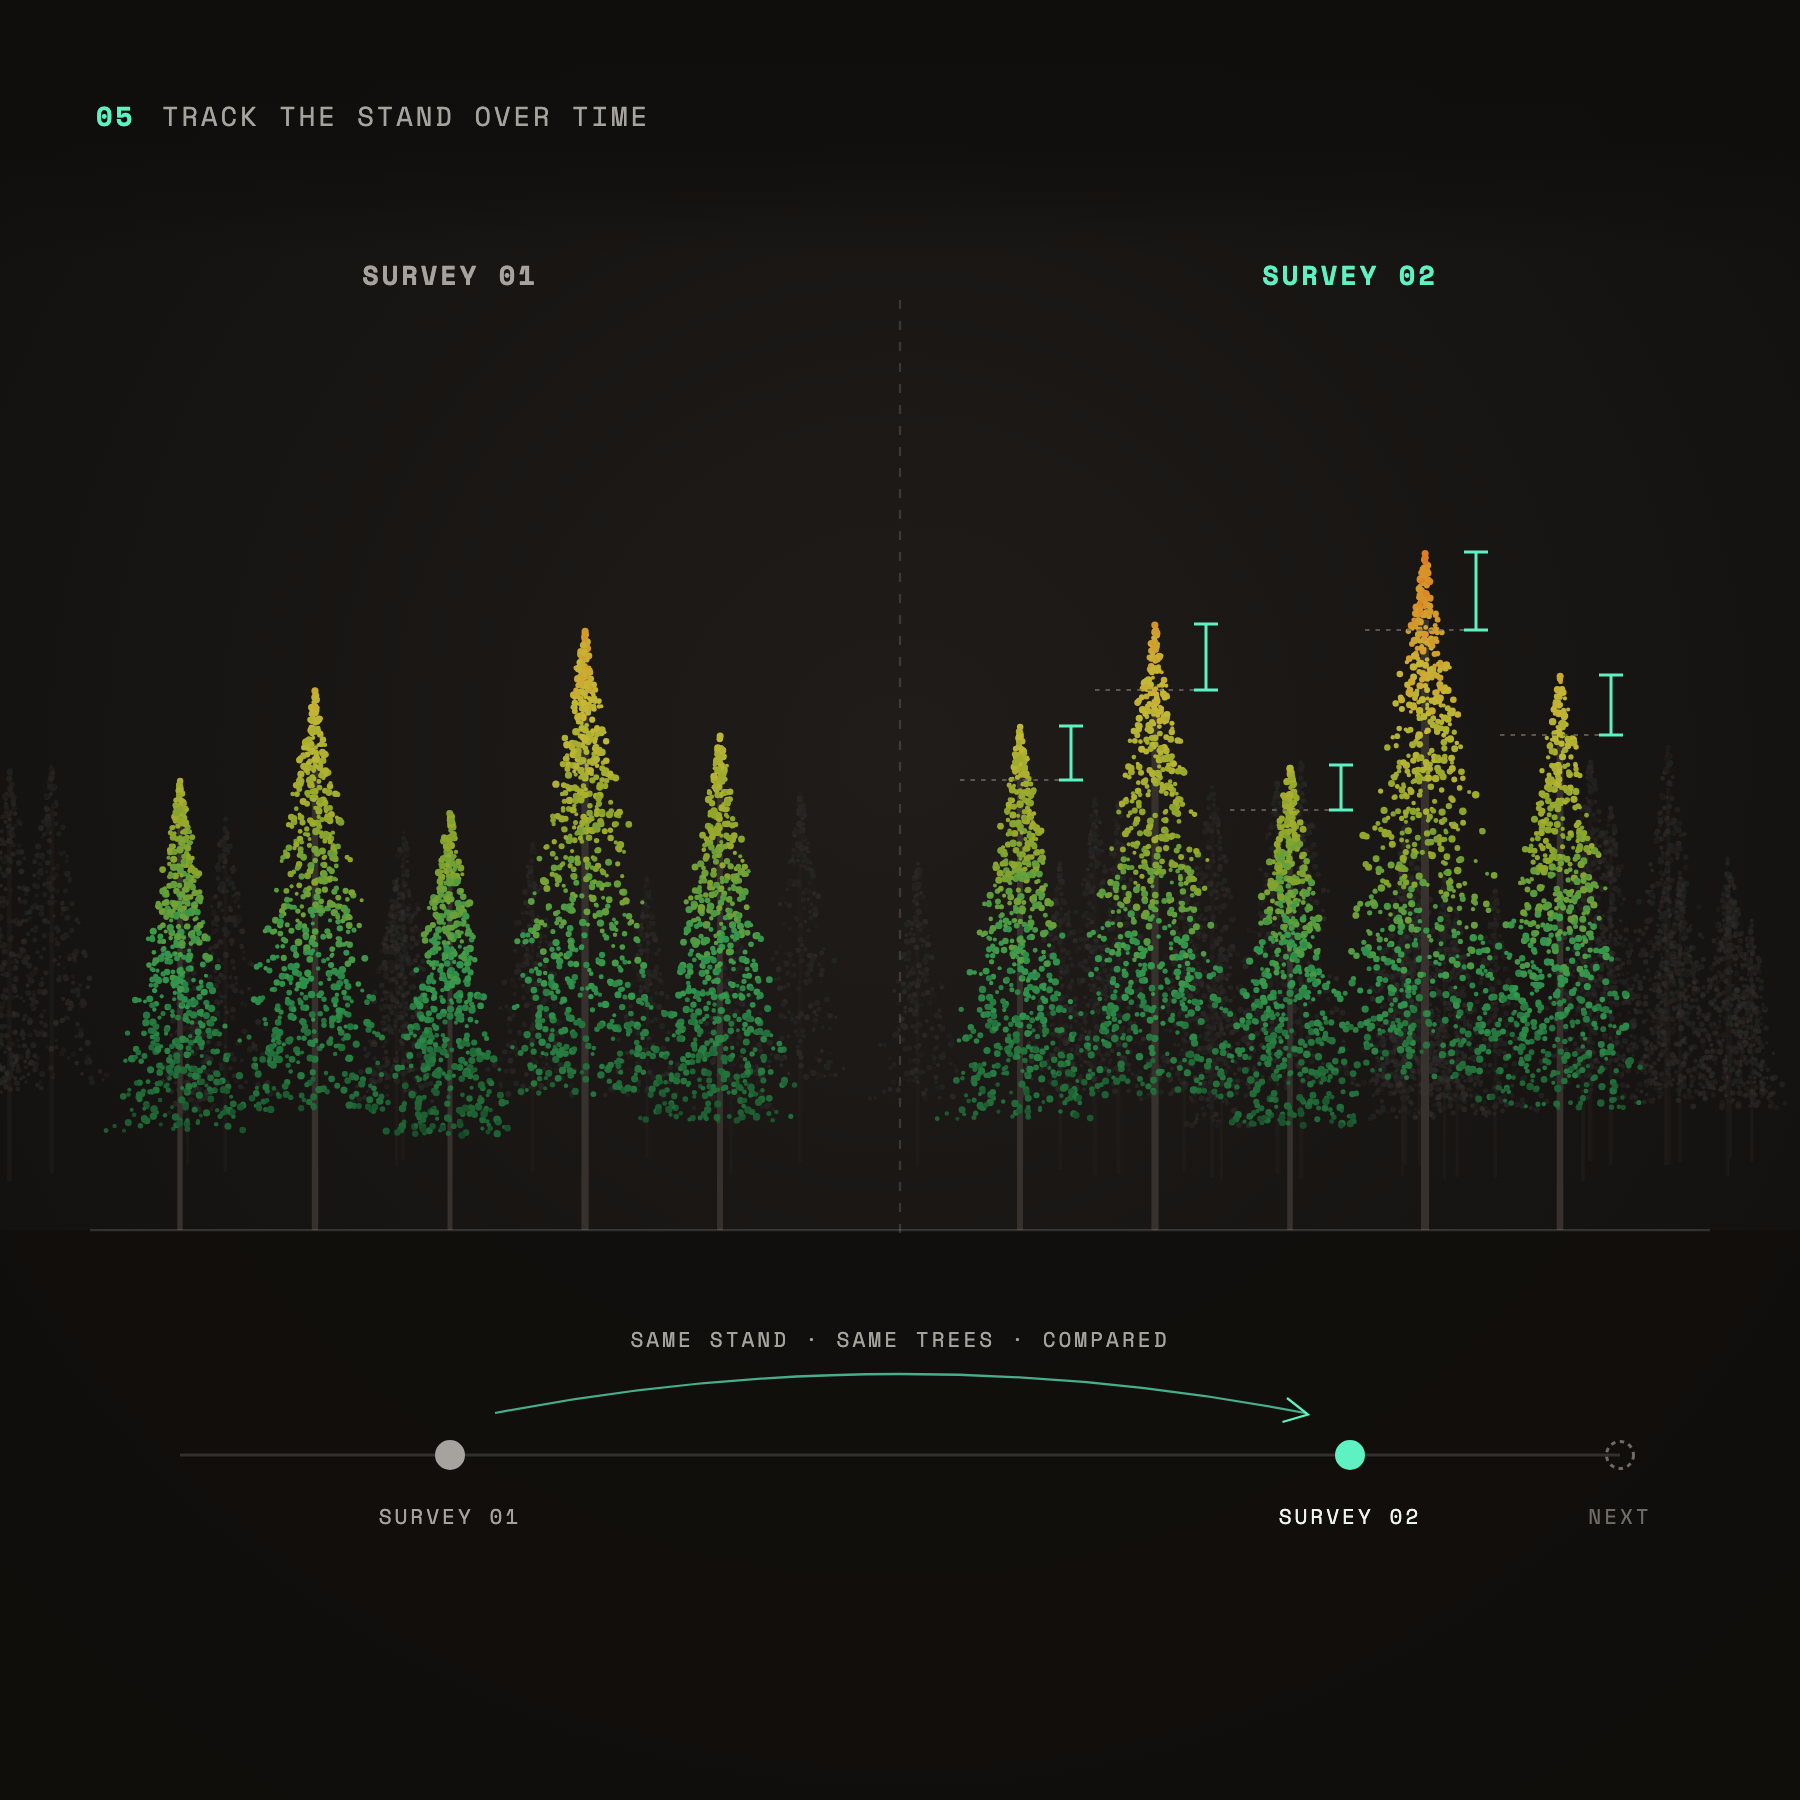
Track the stand over time: the same trees compared between survey 1 and survey 2 to show growth
Track the stand over time
Survey again and compare, instead of starting from scratch.
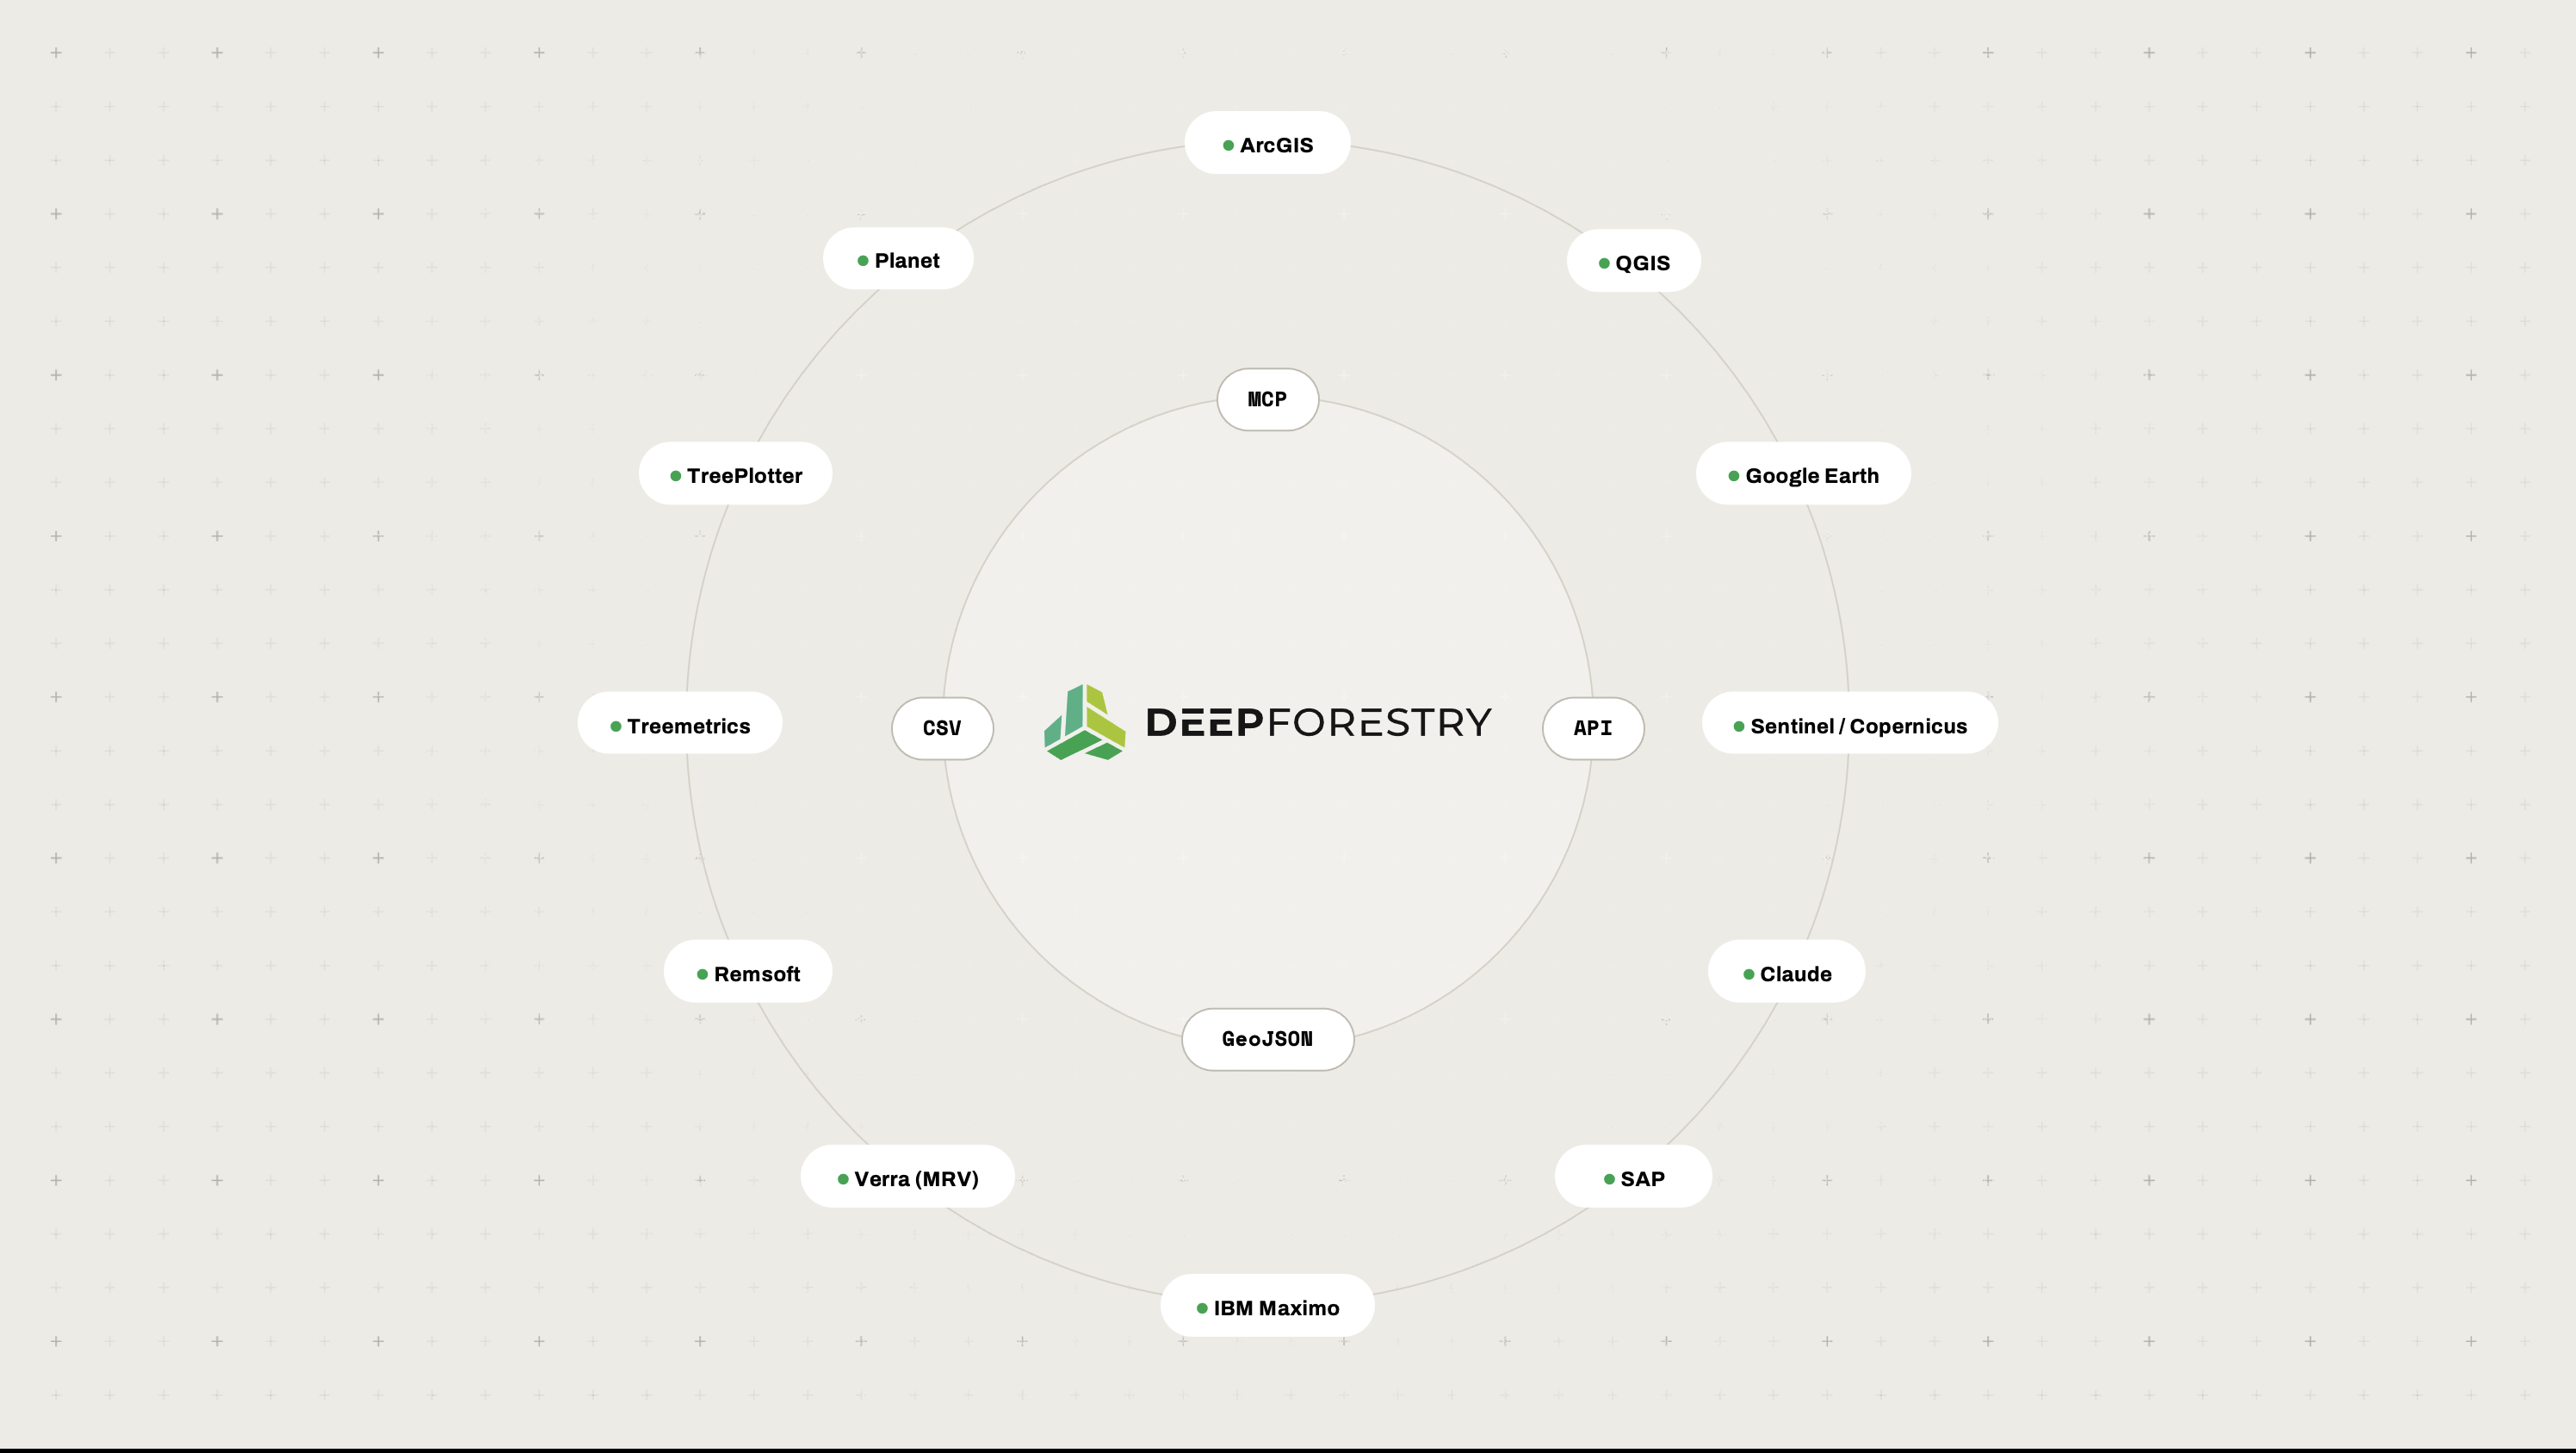
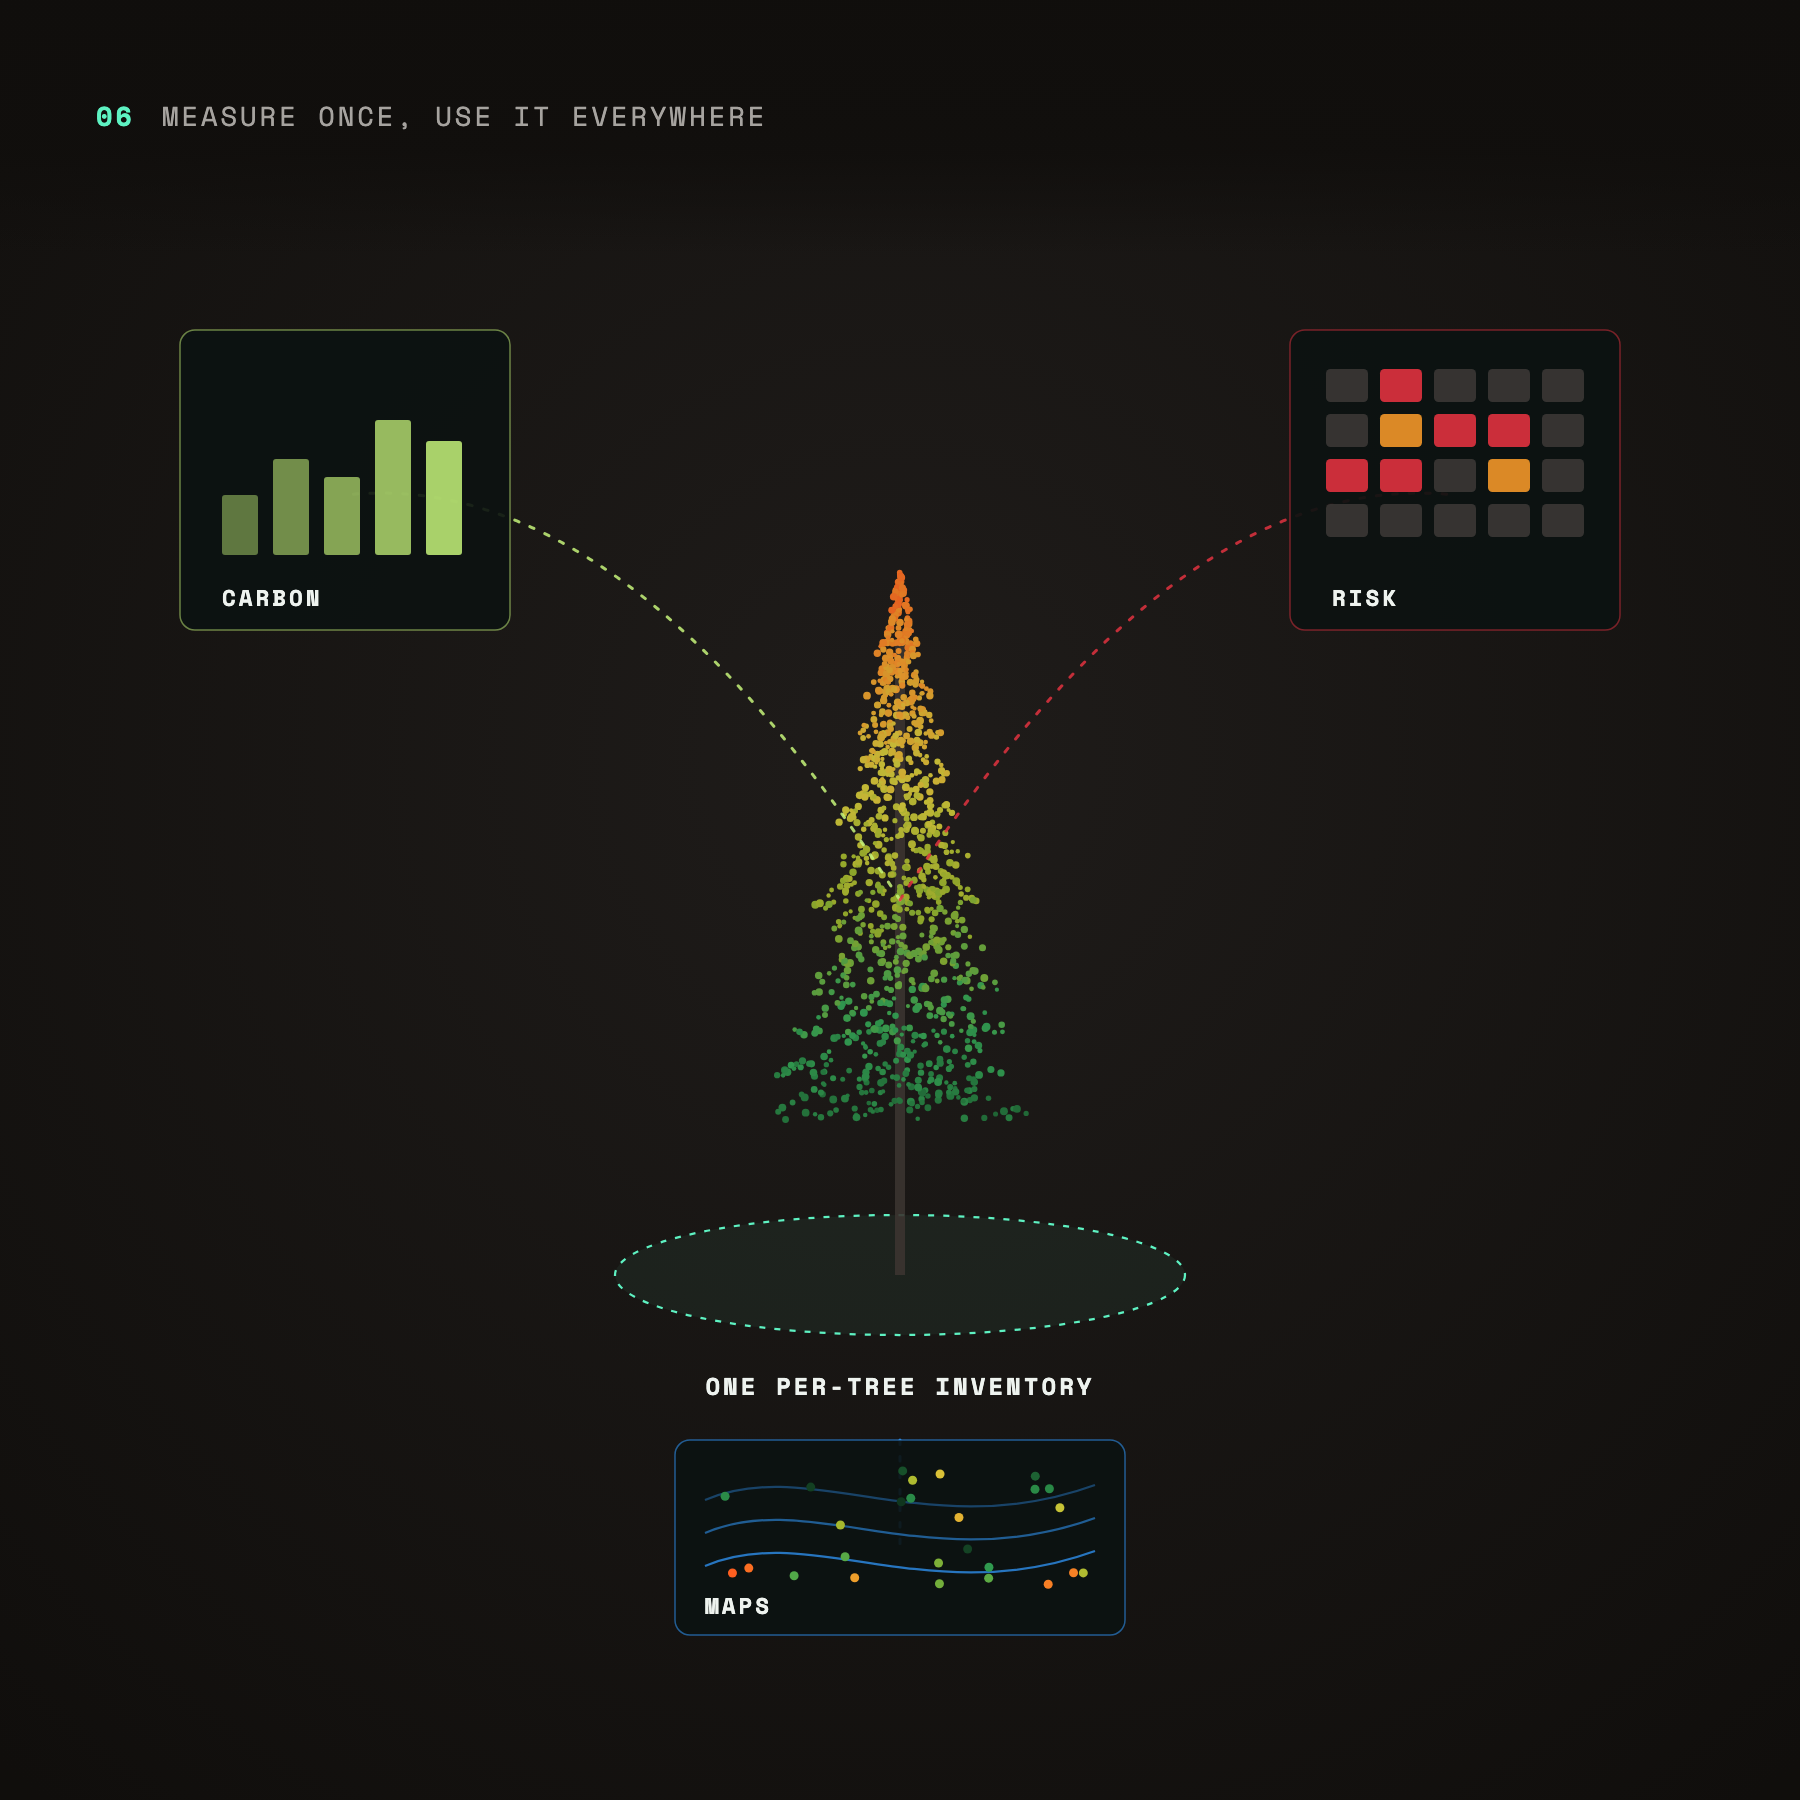
Measure once, use everywhere: one per-tree inventory feeding carbon, risk and map outputs
Measure once, use it everywhere
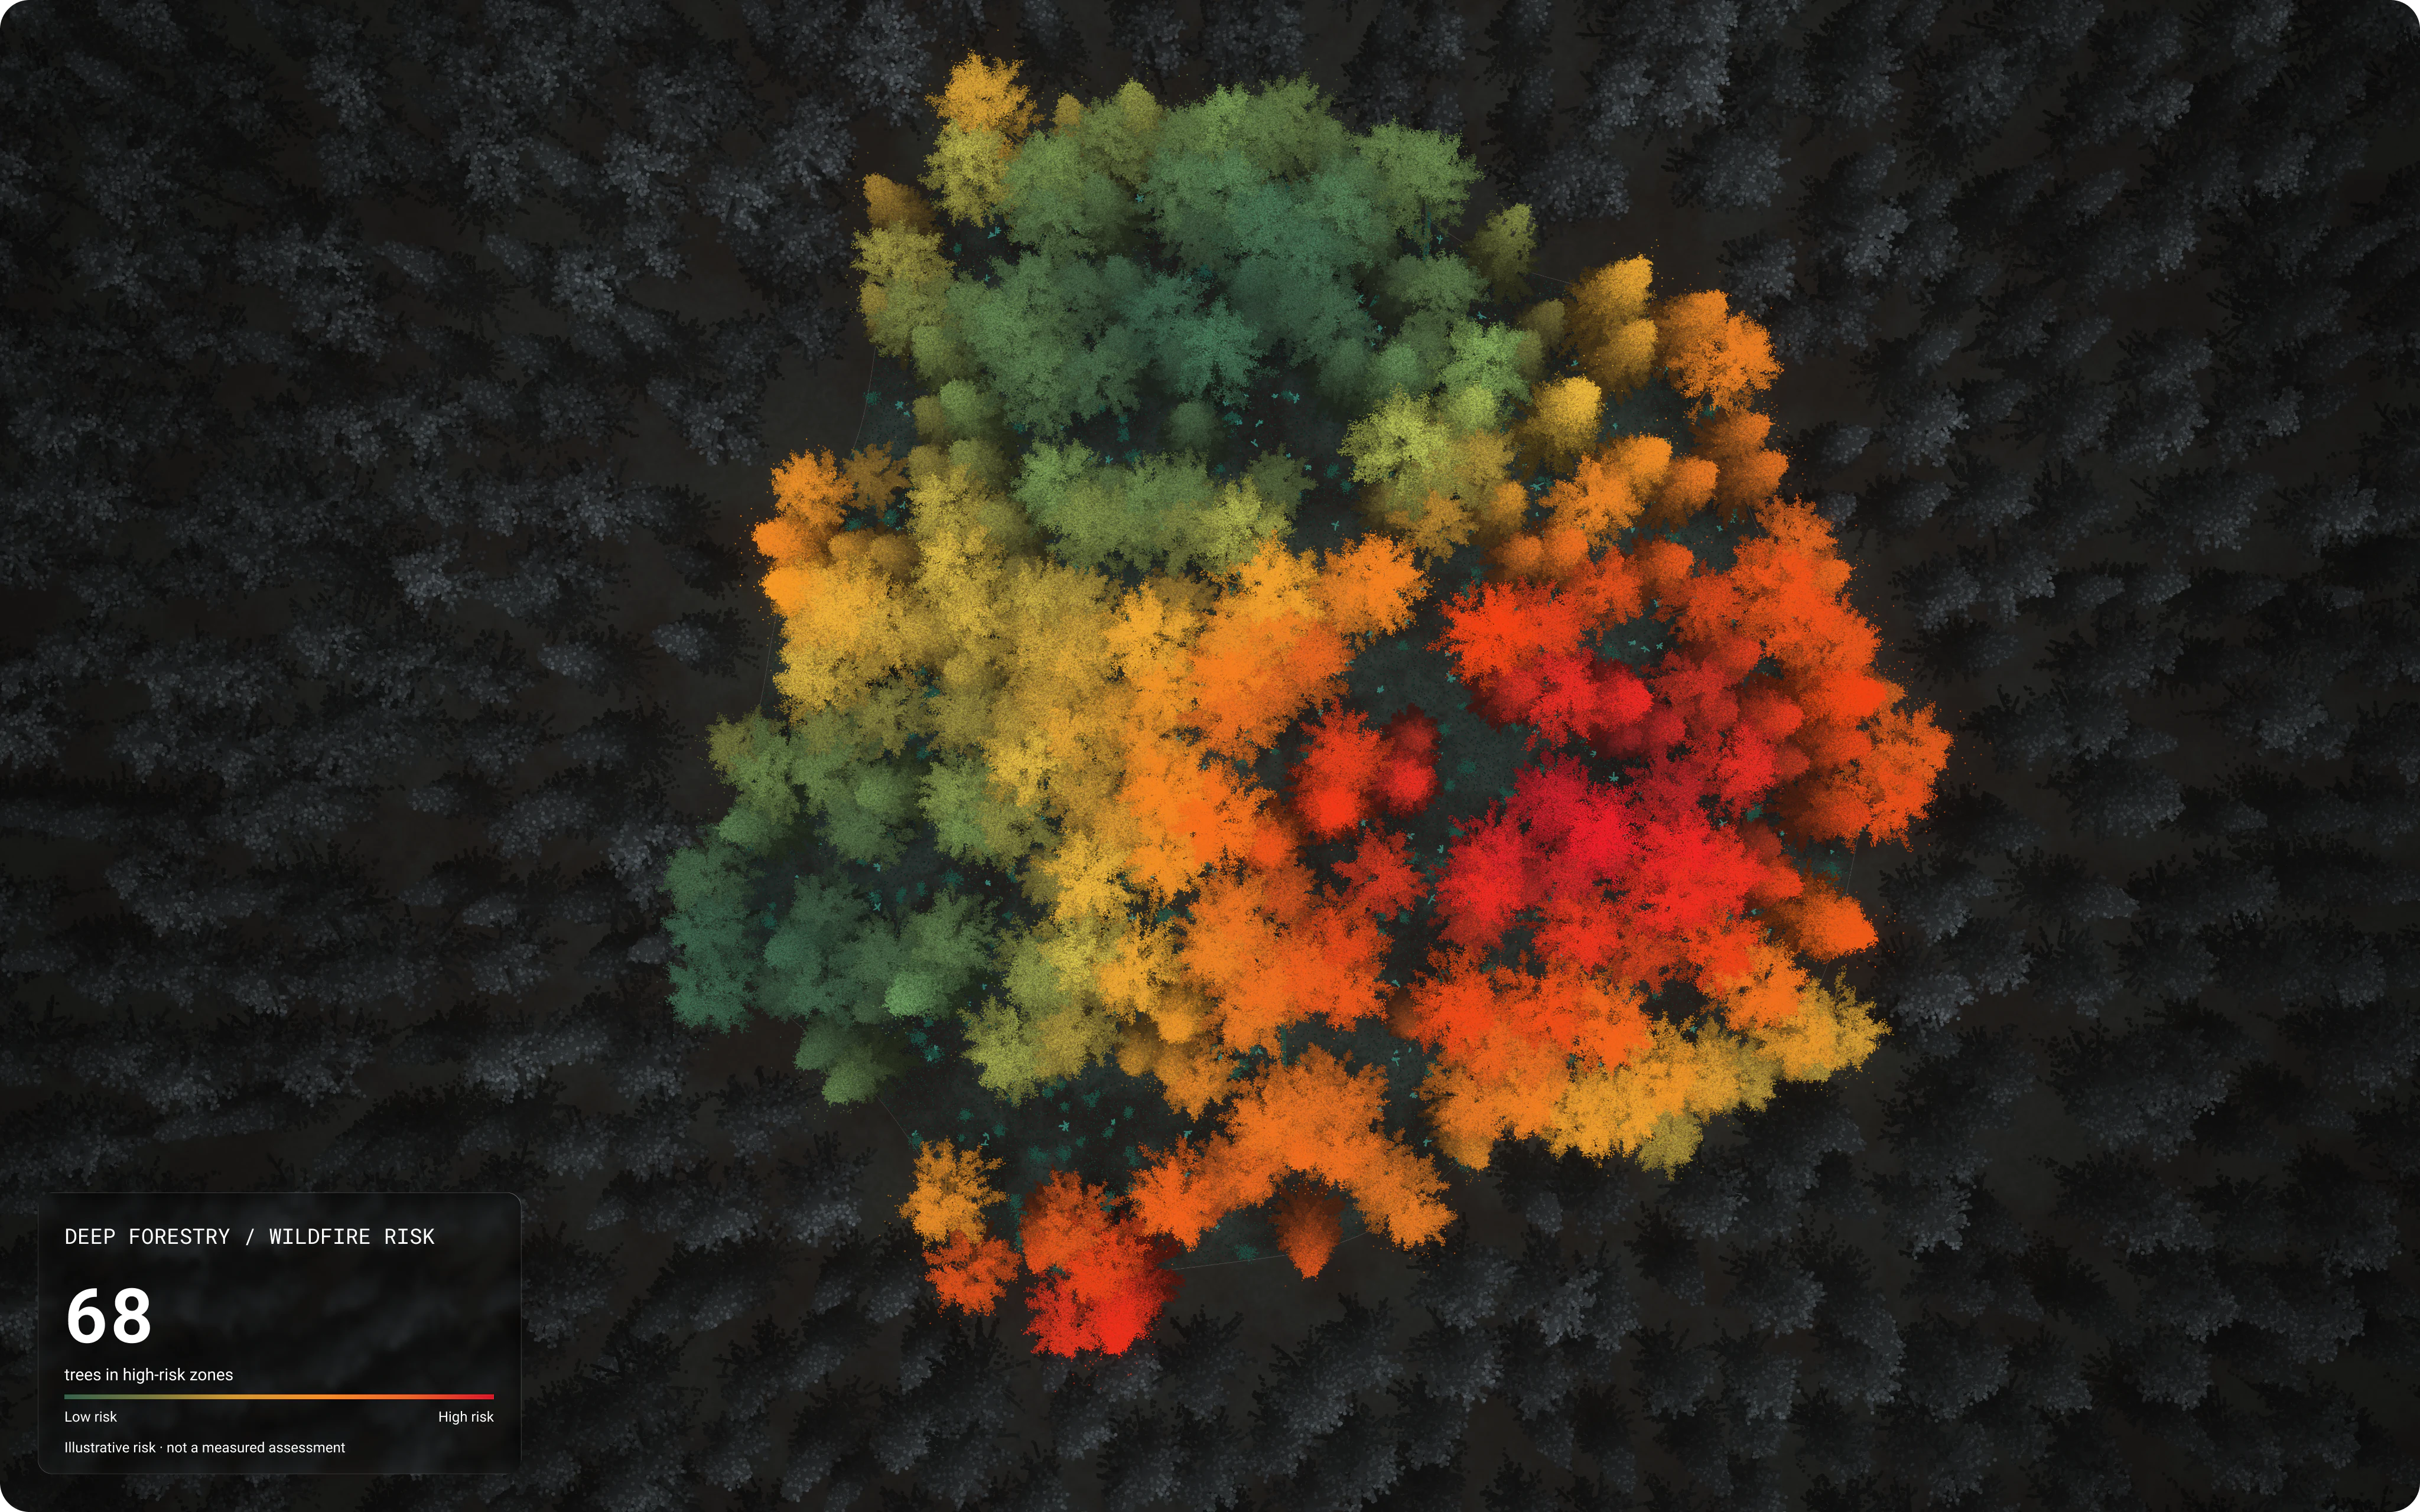
The same per-tree inventory feeds carbon, risk and mapping.
get started now

Pick a stand.
We’ll show you every tree in it.