Vegetation and asset risk

Scroll to learn more
THE Problem

Corridor vegetation is managed one emergency at a time.

Reactive
Find a problem tree, then race the clock.
Patrols flag hazard trees one by one. In regulated markets, each starts a deadline only certified crews can meet.
Seen from above
Risk models look at dots on a map.
Satellites show crowns, not stems, lean or whether a tree can reach the line. Modellers rarely walk the forest.
Unjustified
Hard to defend what you trim, and what you don't.
Regulators, landowners and ratepayers ask why a tree came down. A crew's call on the day is hard to show later.
Widening
Corridors are getting wider.
Every extra metre is more trees to assess and cut, still measured by hand along thousands of kilometres of line.
Left behind
Cut timber is estimated by eye.
Logs left after clearing must be removed or managed. Their volume is guessed from maps and photos, not measured.
Critical infrastructure
The data has to stay where it belongs.
Grid data is sensitive. Operators need collection that works offline, with storage and processing in the right country.
From capture to value

From a corridor scan to a crew list you can defend.

The world first
‍end-to-end physical AI in Nature

What you receive

For every tree, every span and the whole corridor.

Per tree
Position
WGS84 and UTM, with ground elevation.
Height
From the terrain model under the canopy.
Diameter and stem
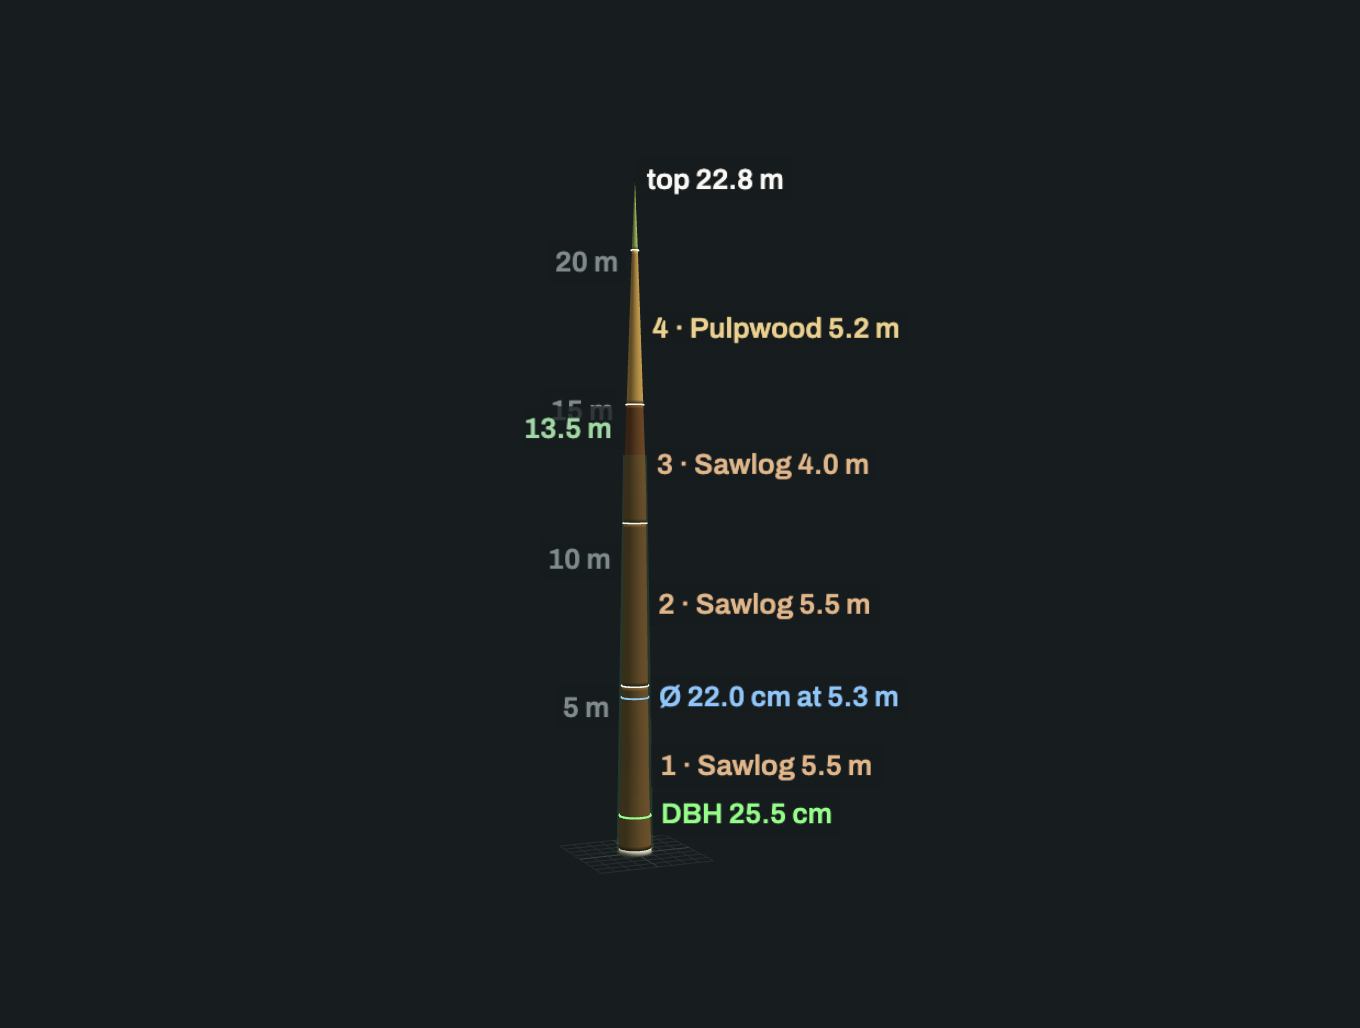
DBH and stem curve.
Lean
Direction and angle, through the application layer.
Distance to the line
Using your conductor geometry.
Reach
Whether its height and lean could bring it to the line.
Verdict
How well it was seen, and whether it is reliable.
Per span and corridor
Tree count
And density per hectare.
Trees by zone
Within each clearance band you define.
Clearance profile
Vegetation against the line, span by span.
Volume to cut
Timber in a planned widening.
Downed logs
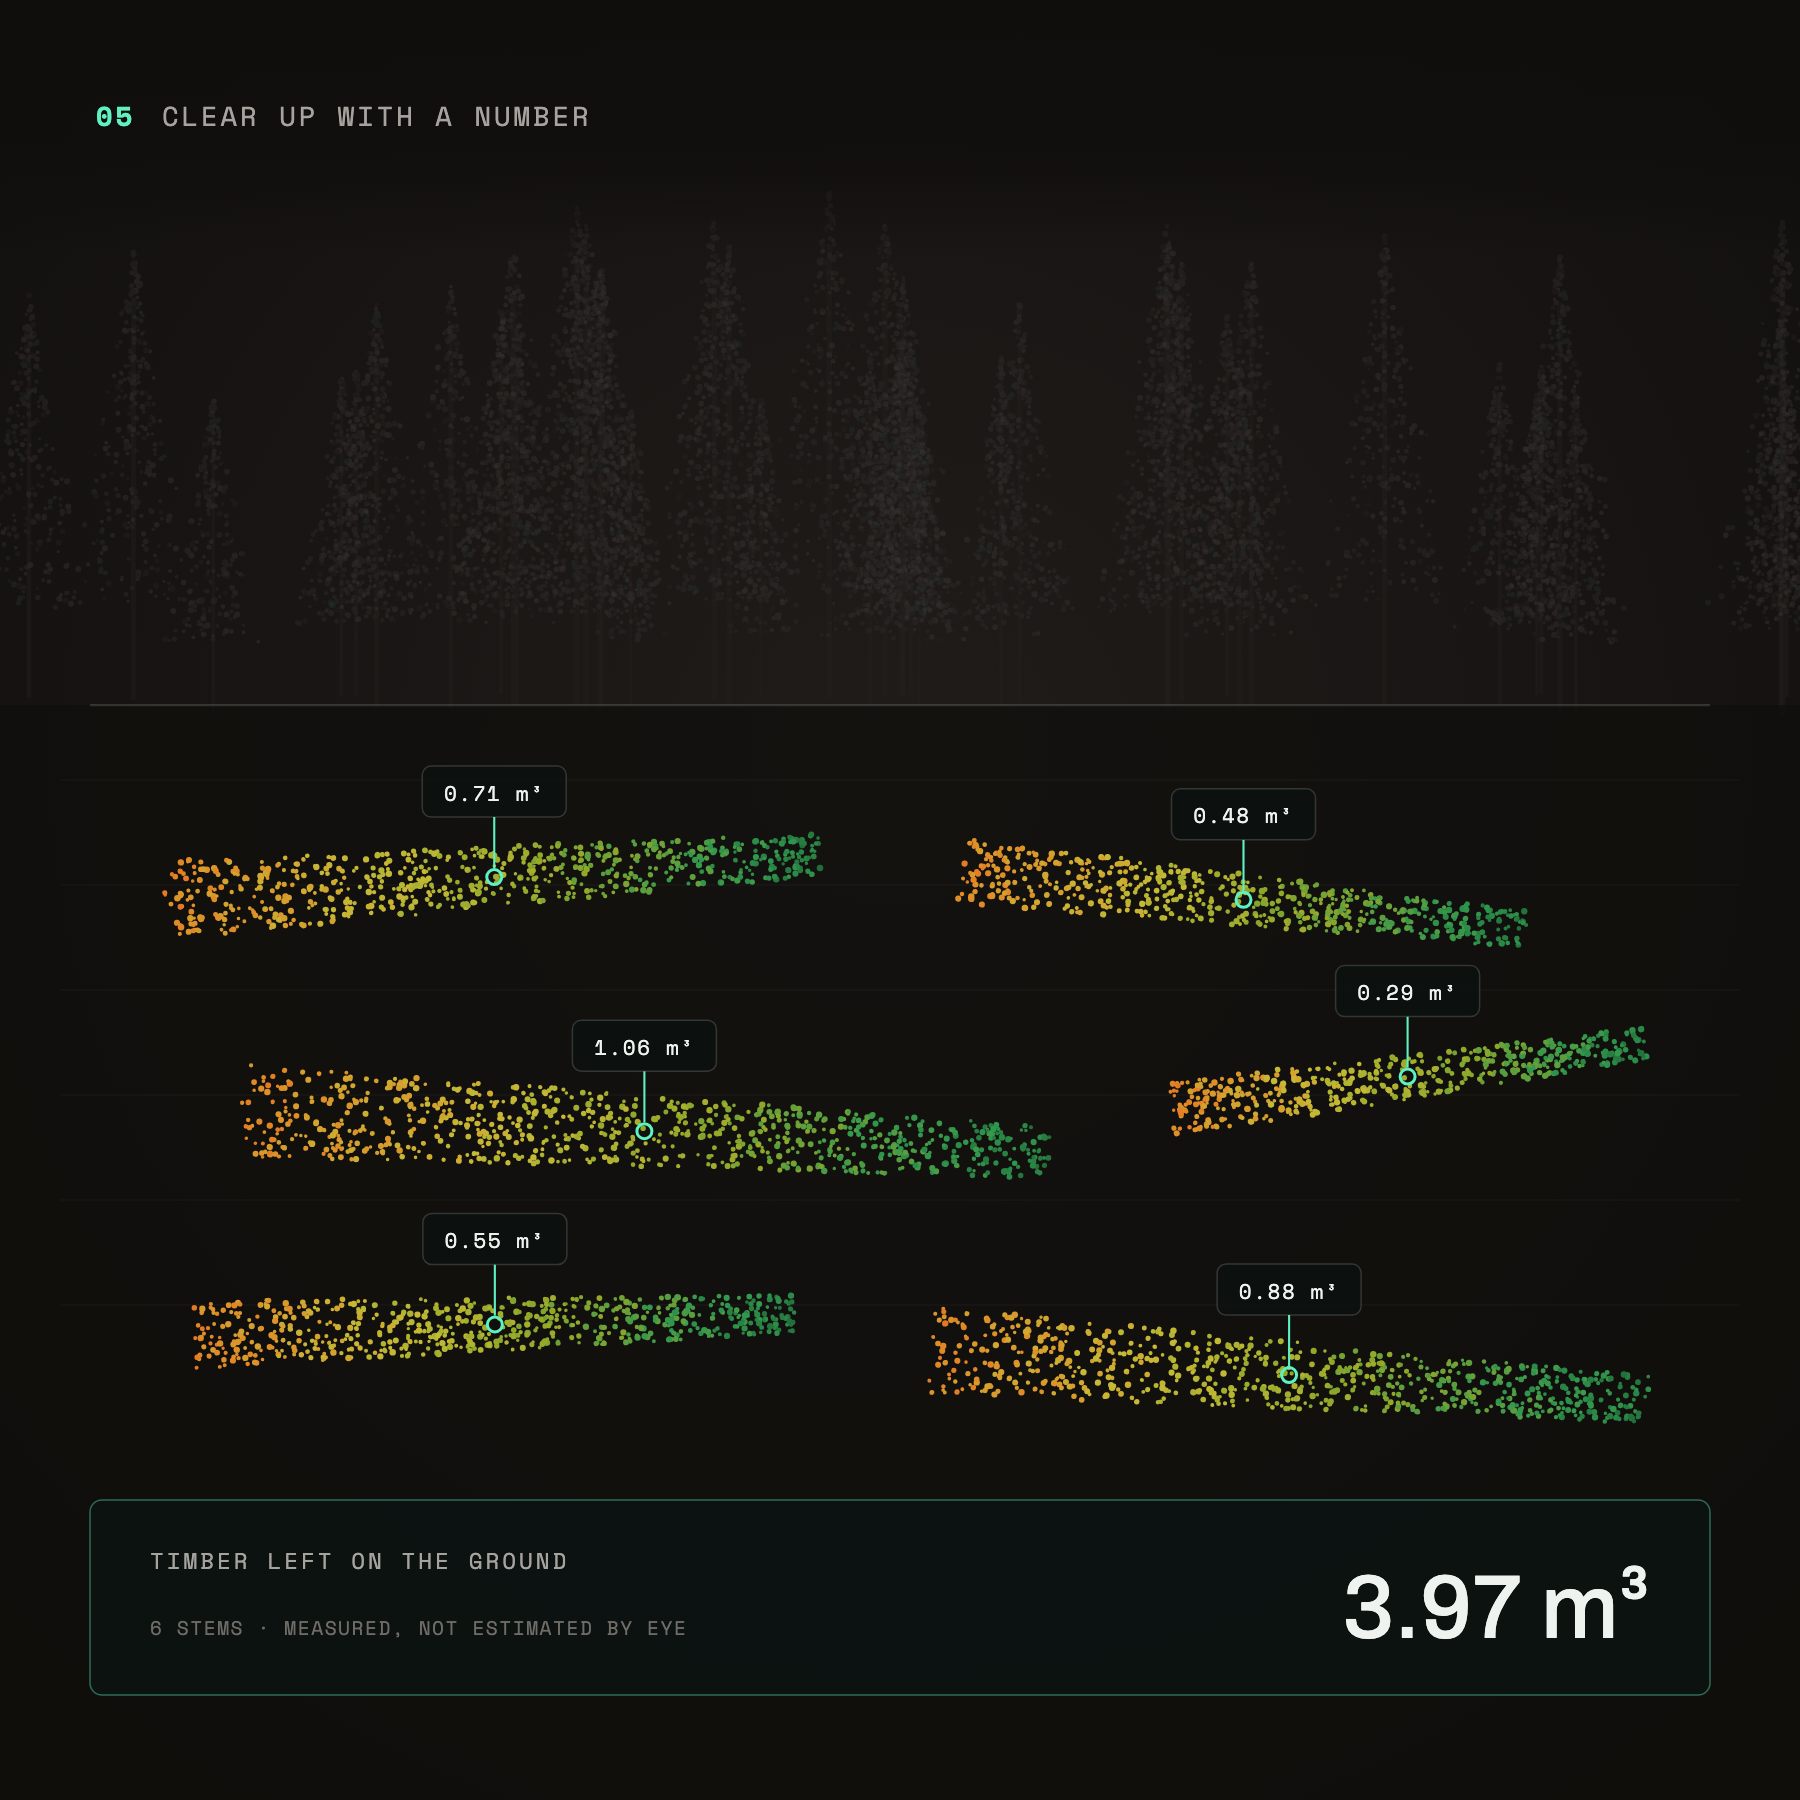
Volume of timber already on the ground.
Change
Growth between surveys.
Files and application
Crew list
CSV with coordinates, ready for the field.
Map layers
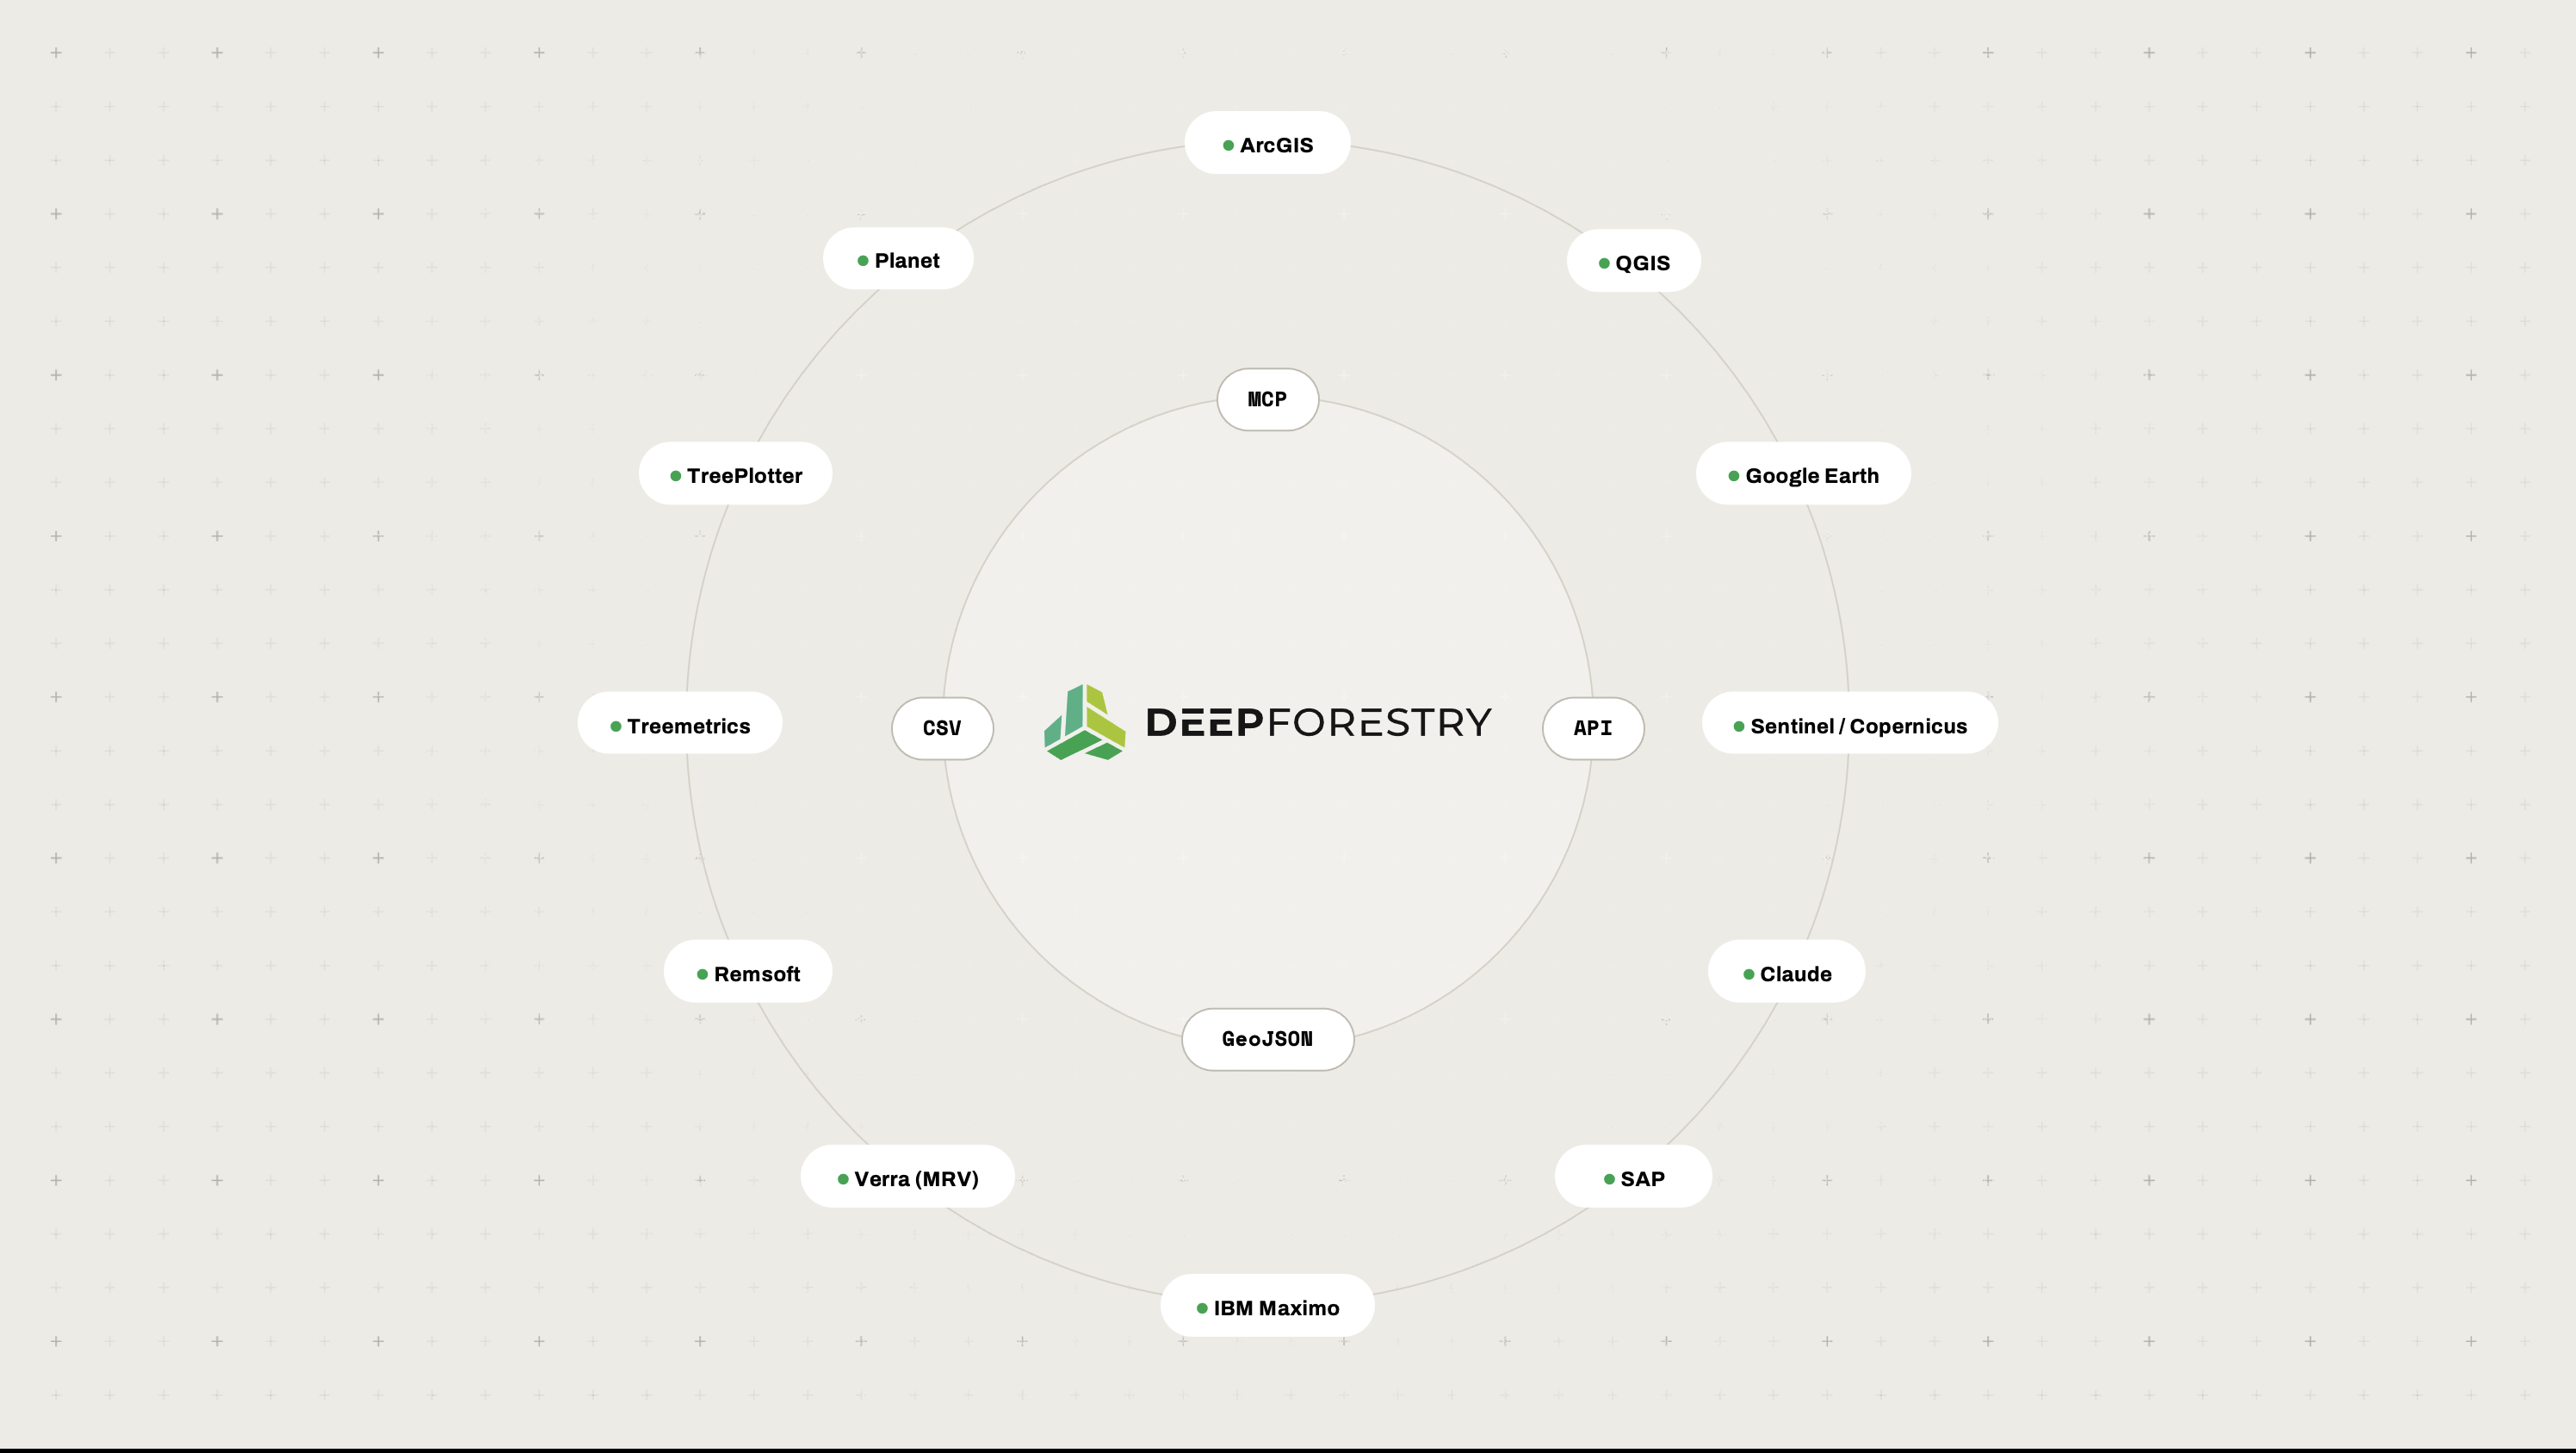
GeoJSON for your GIS and vegetation system.
Point cloud
Georeferenced, for engineering review.
Terrain model
The ground beneath the vegetation.
Application
Heat map, tree cards, 3D view, clearance profile.
Outcomes

The right trees first,
and the reasons on record.

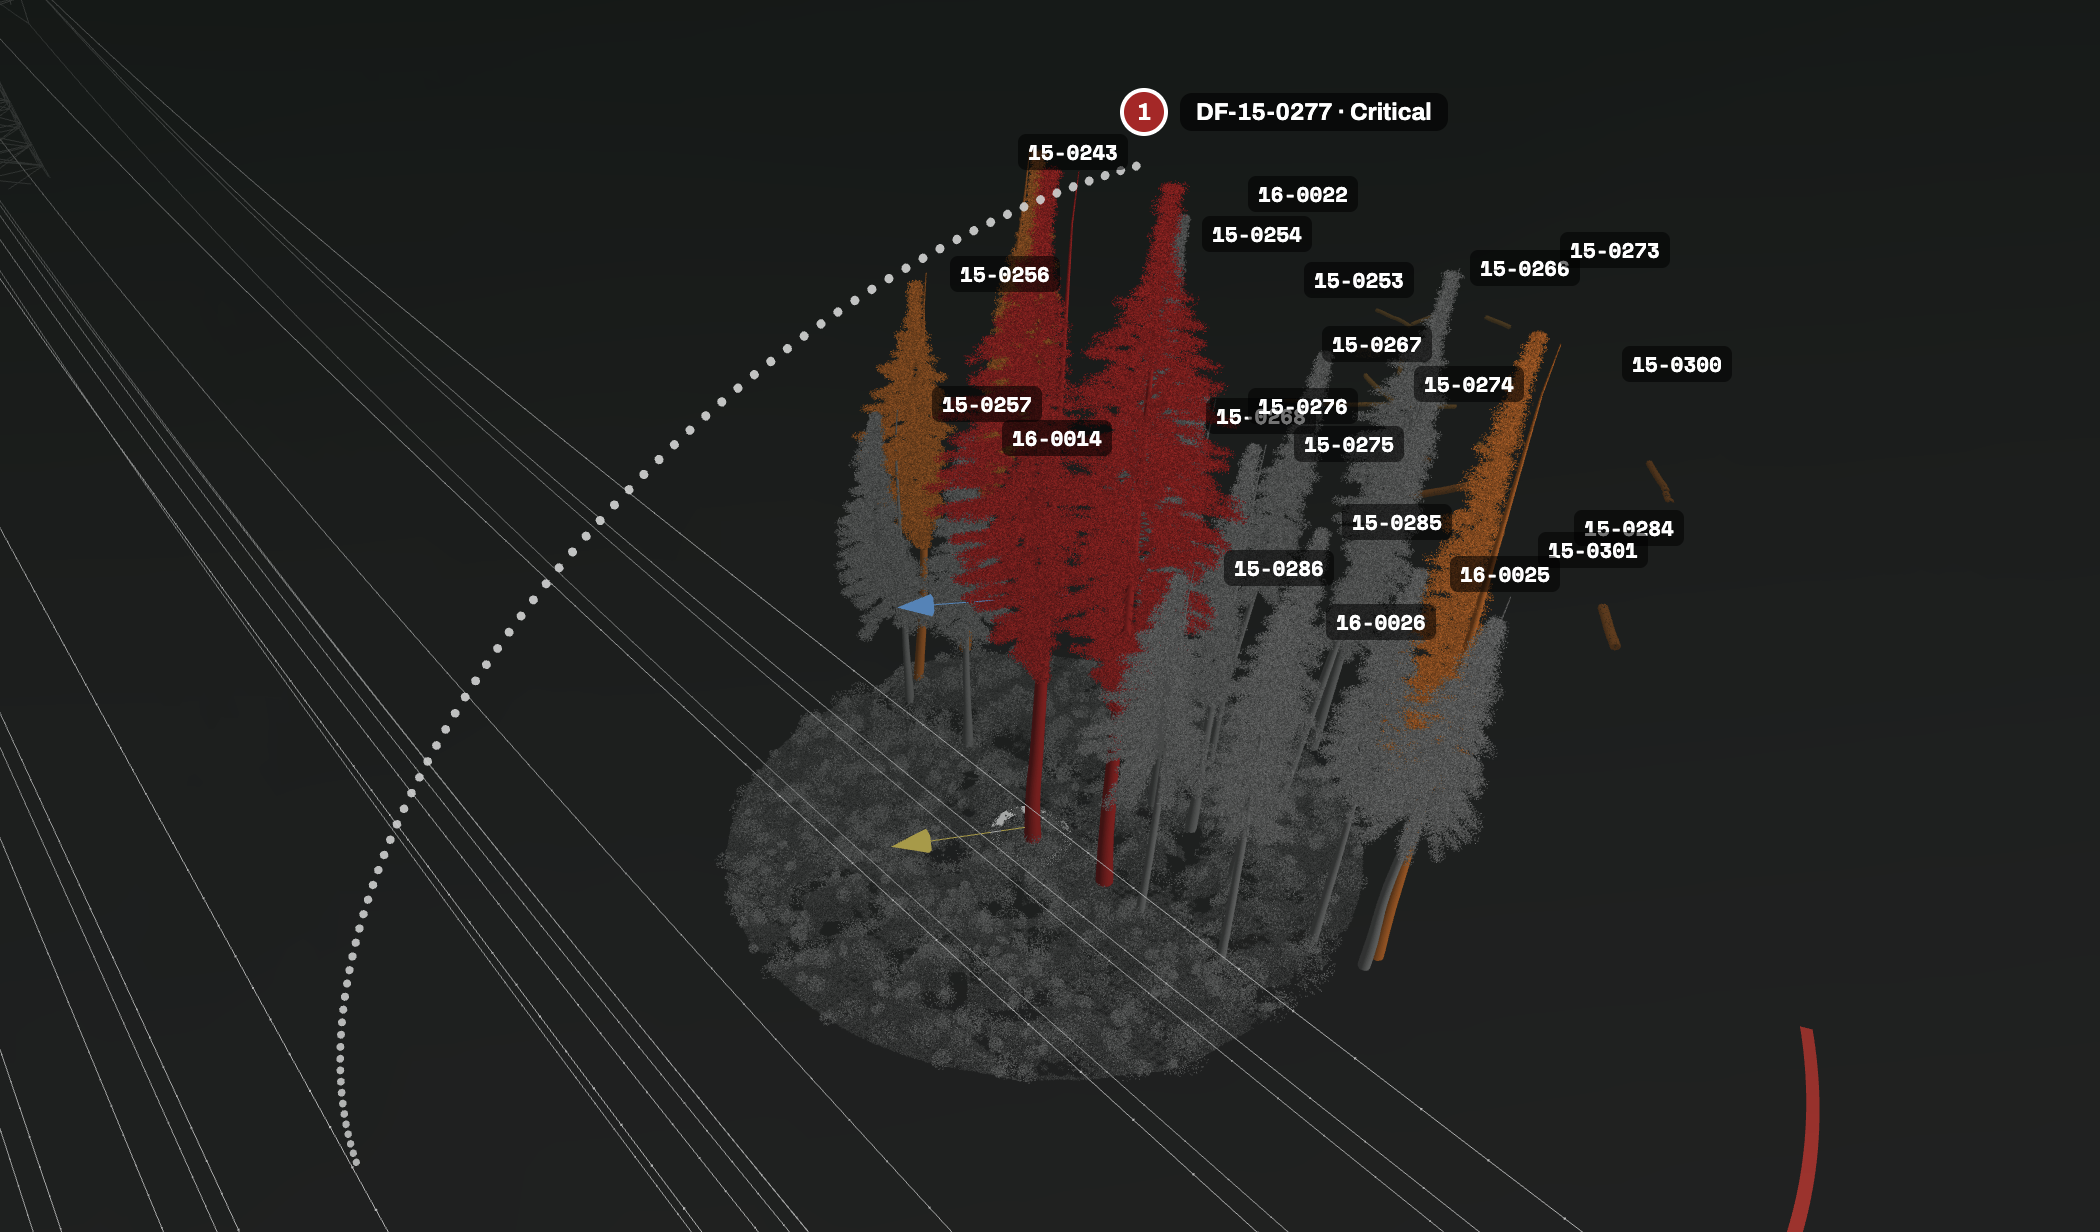
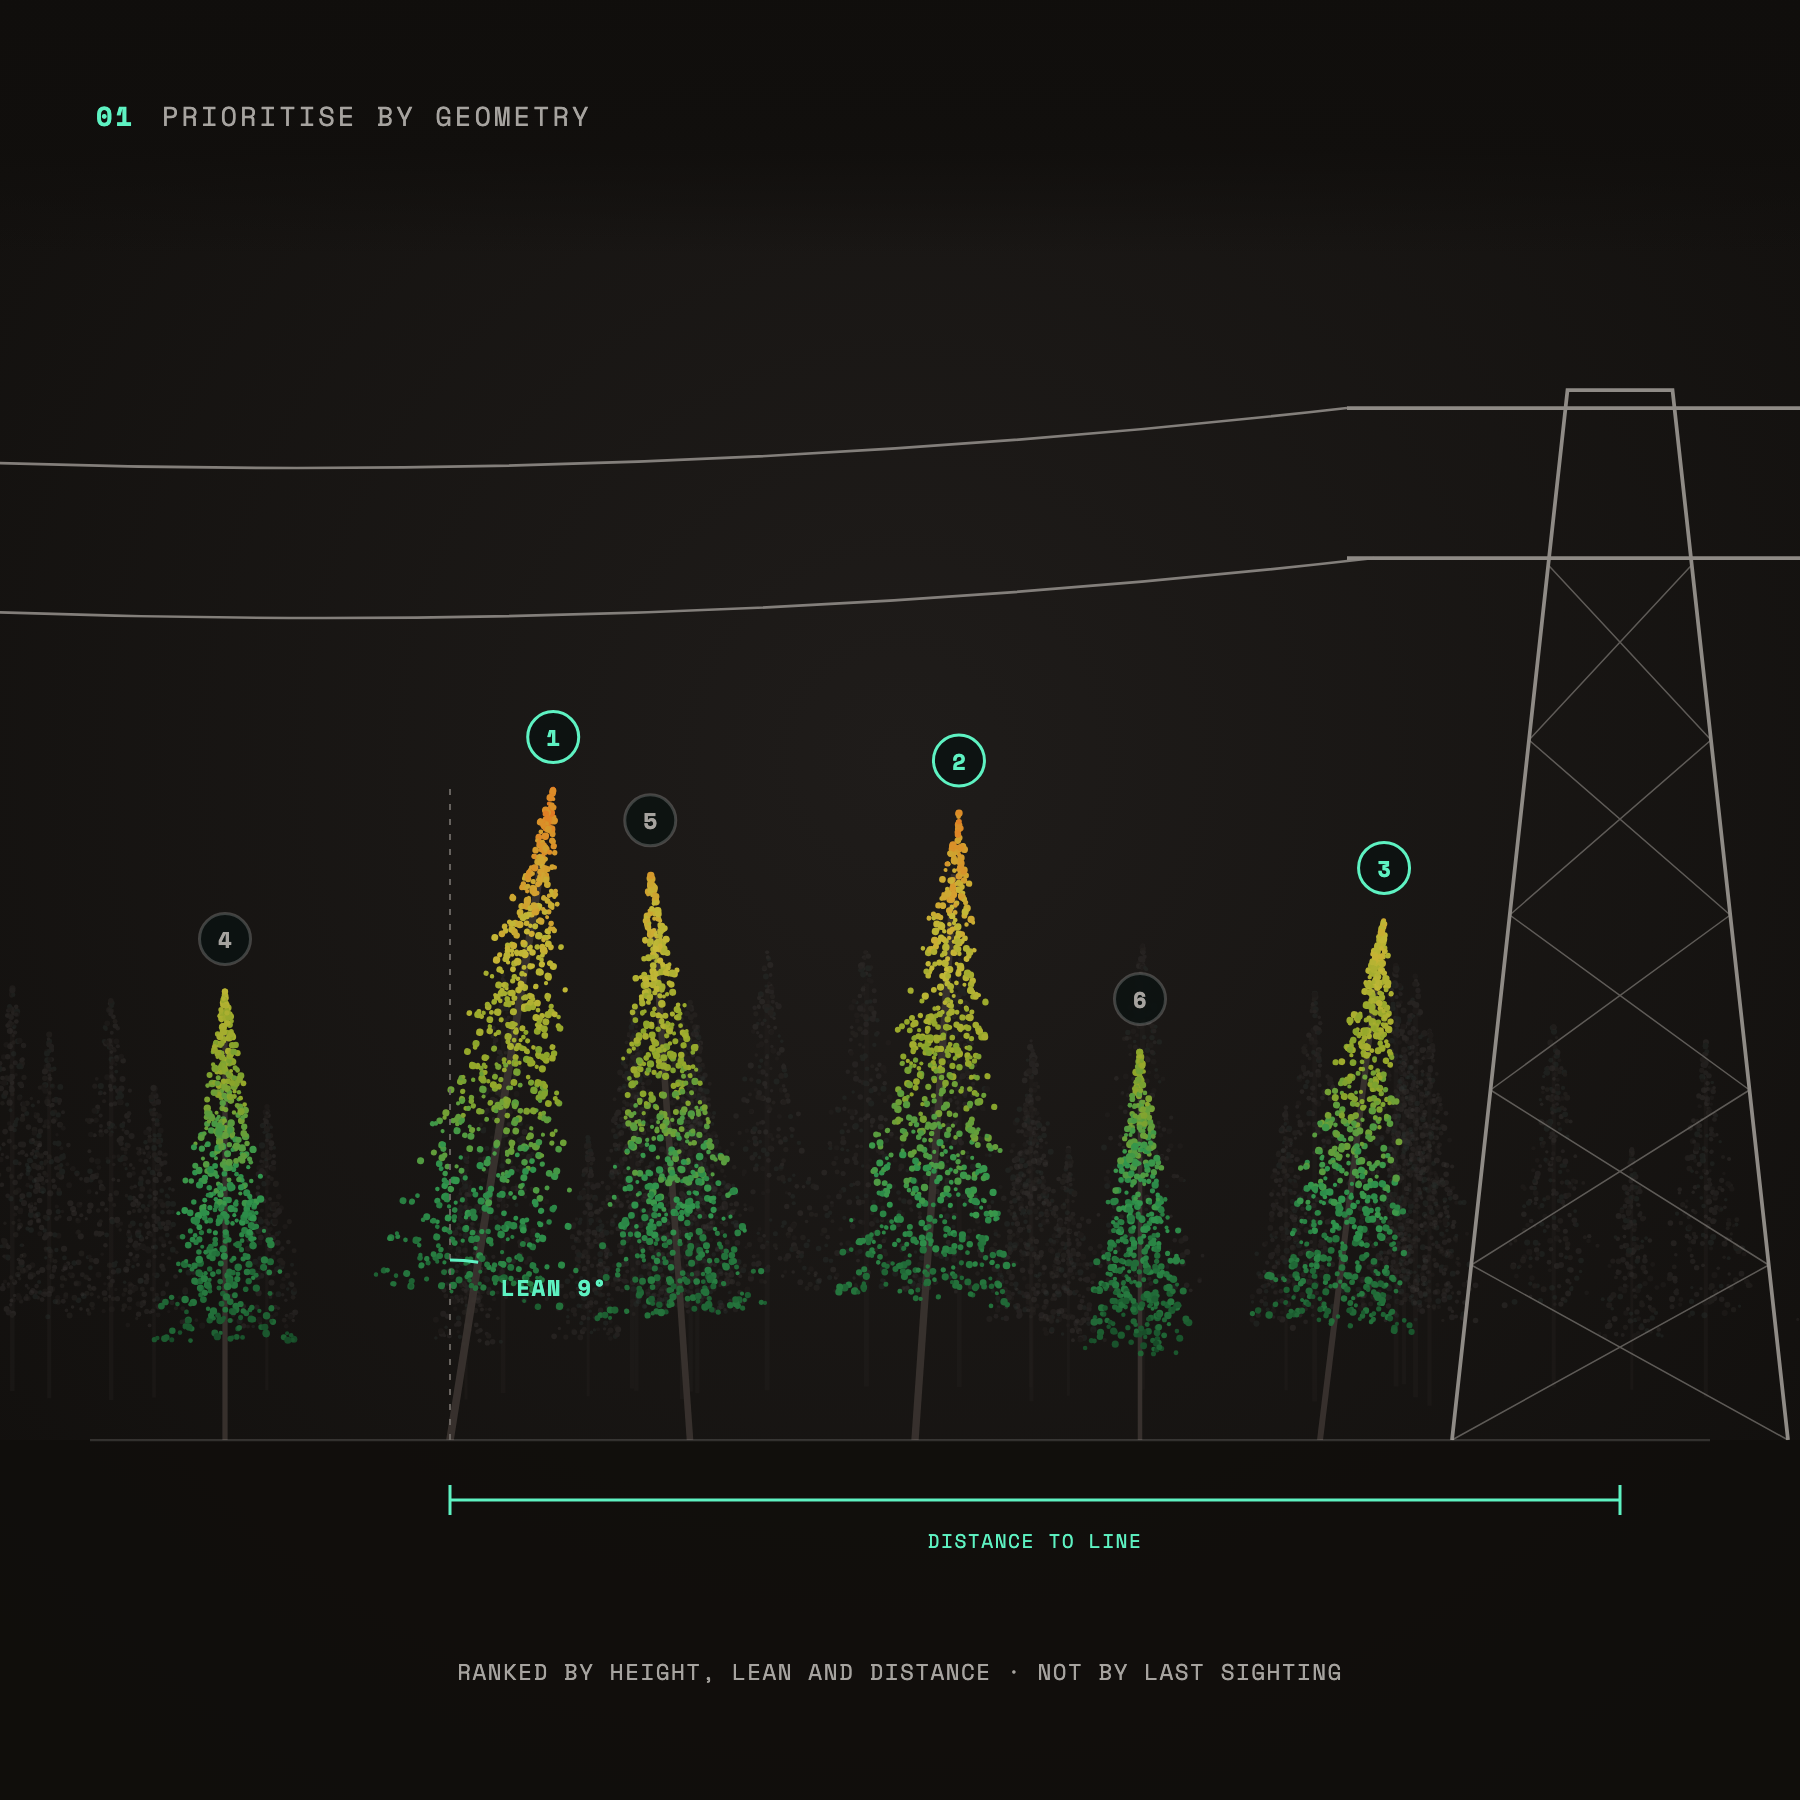
Prioritise by geometry: trees beside a power line ranked by height, lean and distance to the line
Prioritise by geometry
Rank trees by height, lean and distance to the line, not by who saw them last.
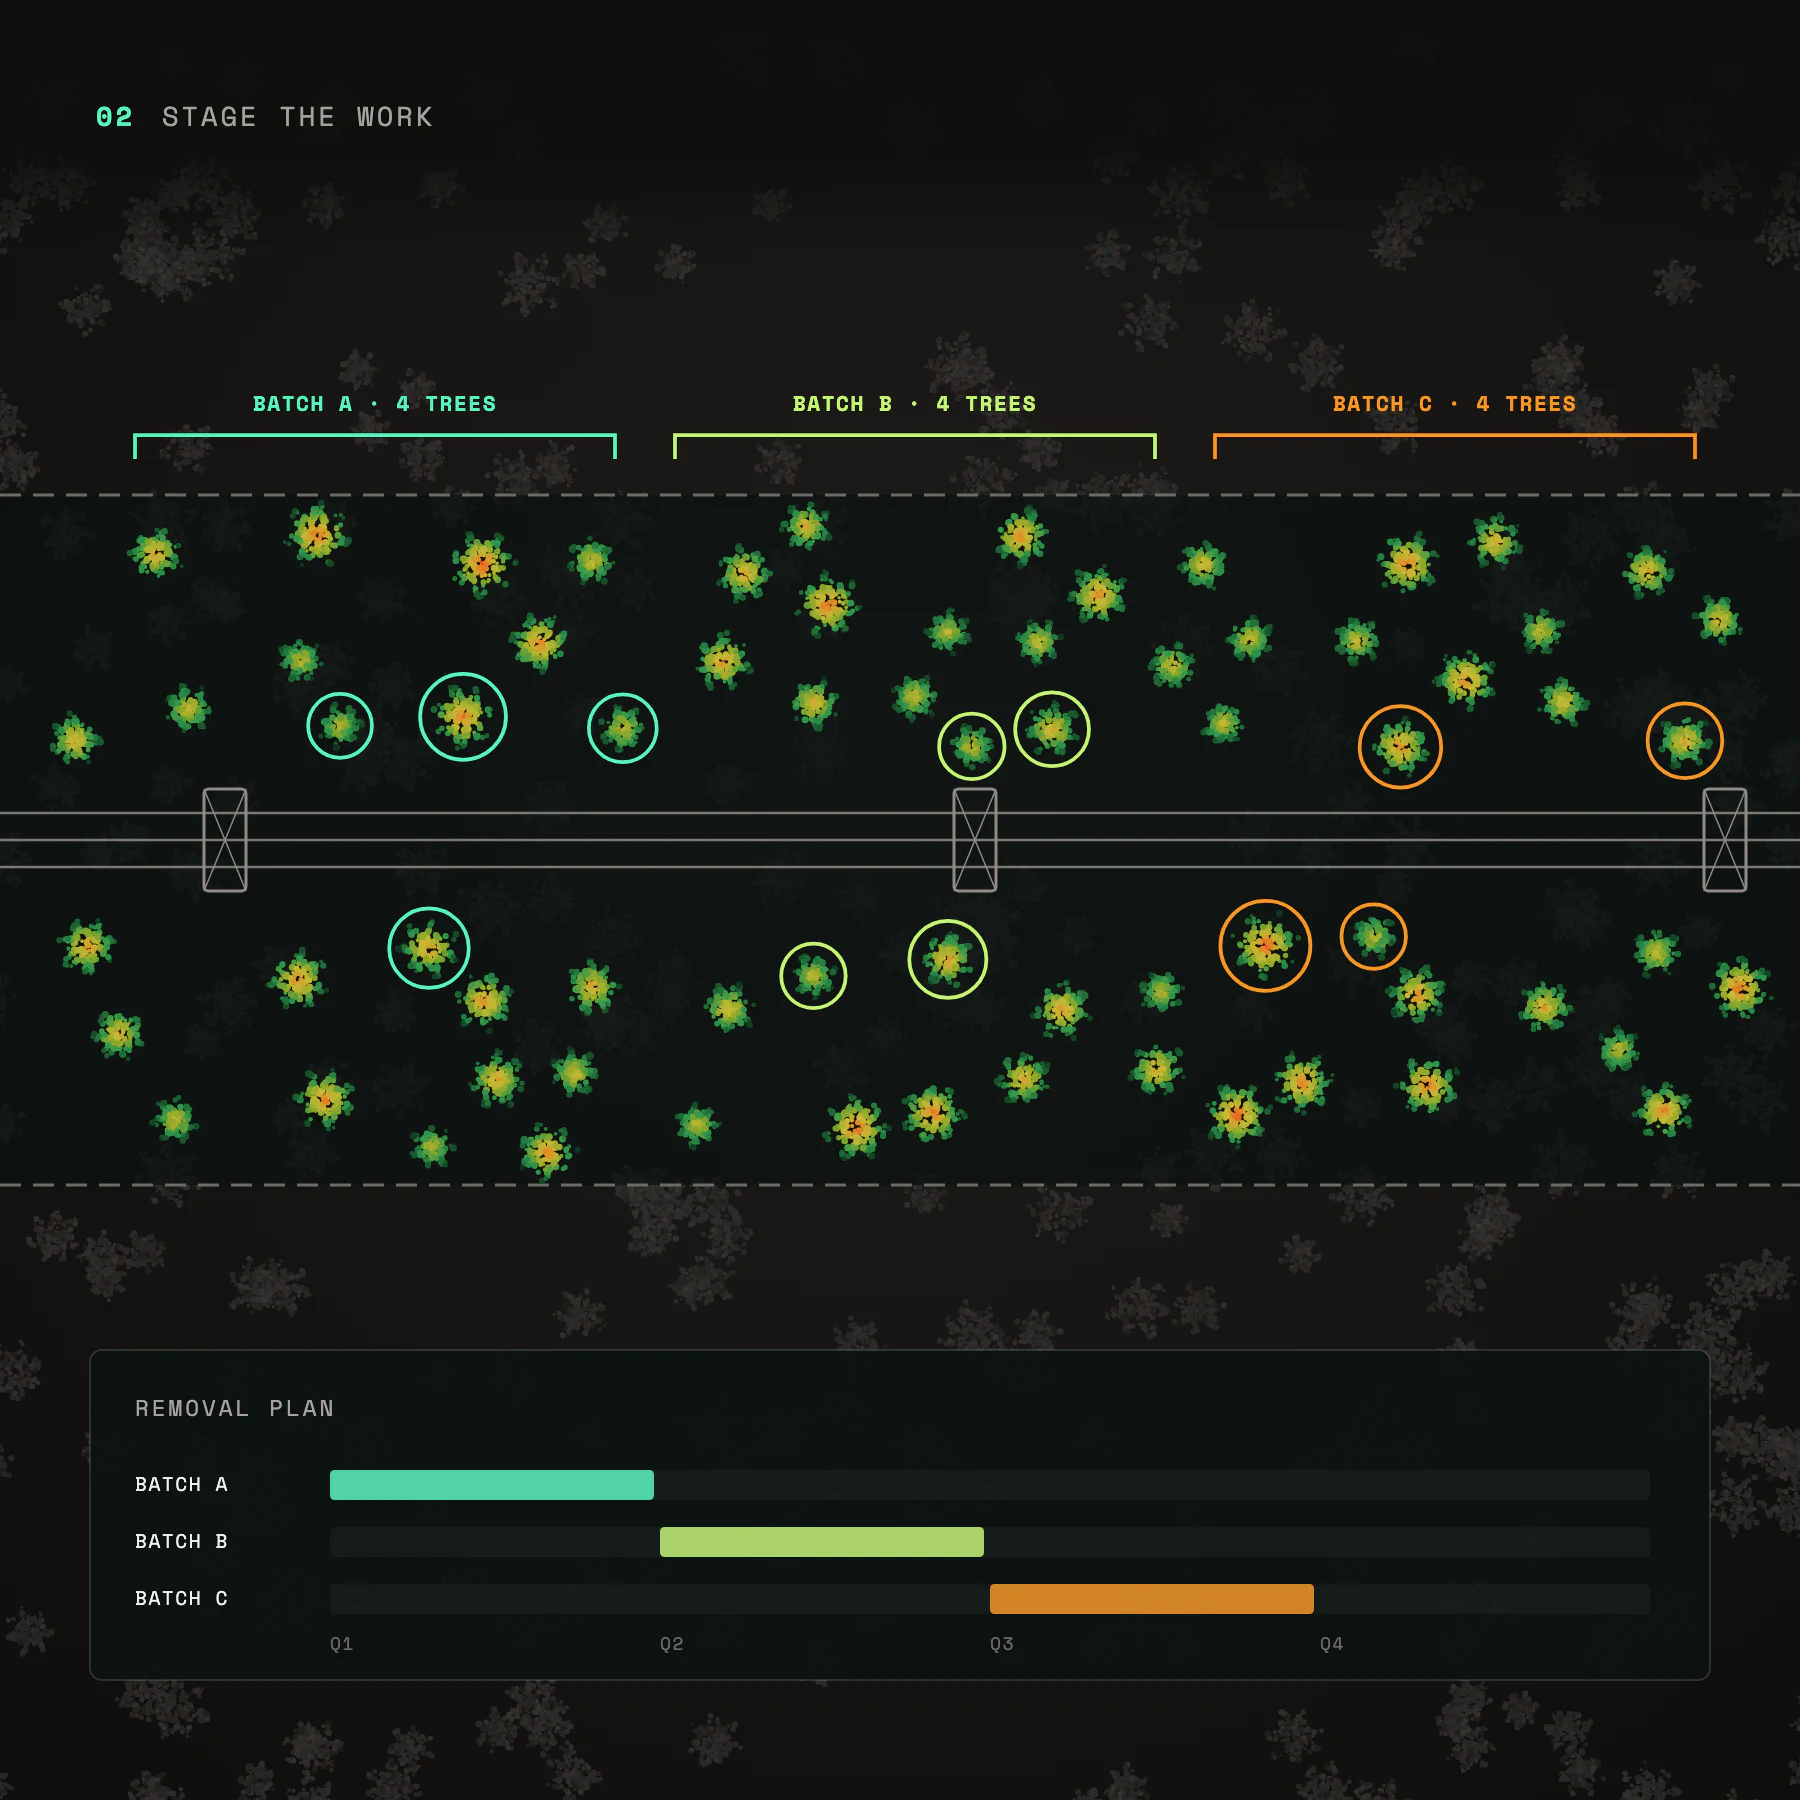
Stage the work: trees along a power line corridor grouped into removal batches A, B and C on a schedule
Stage the work
Plan removals ahead in batches, instead of racing one deadline at a time.
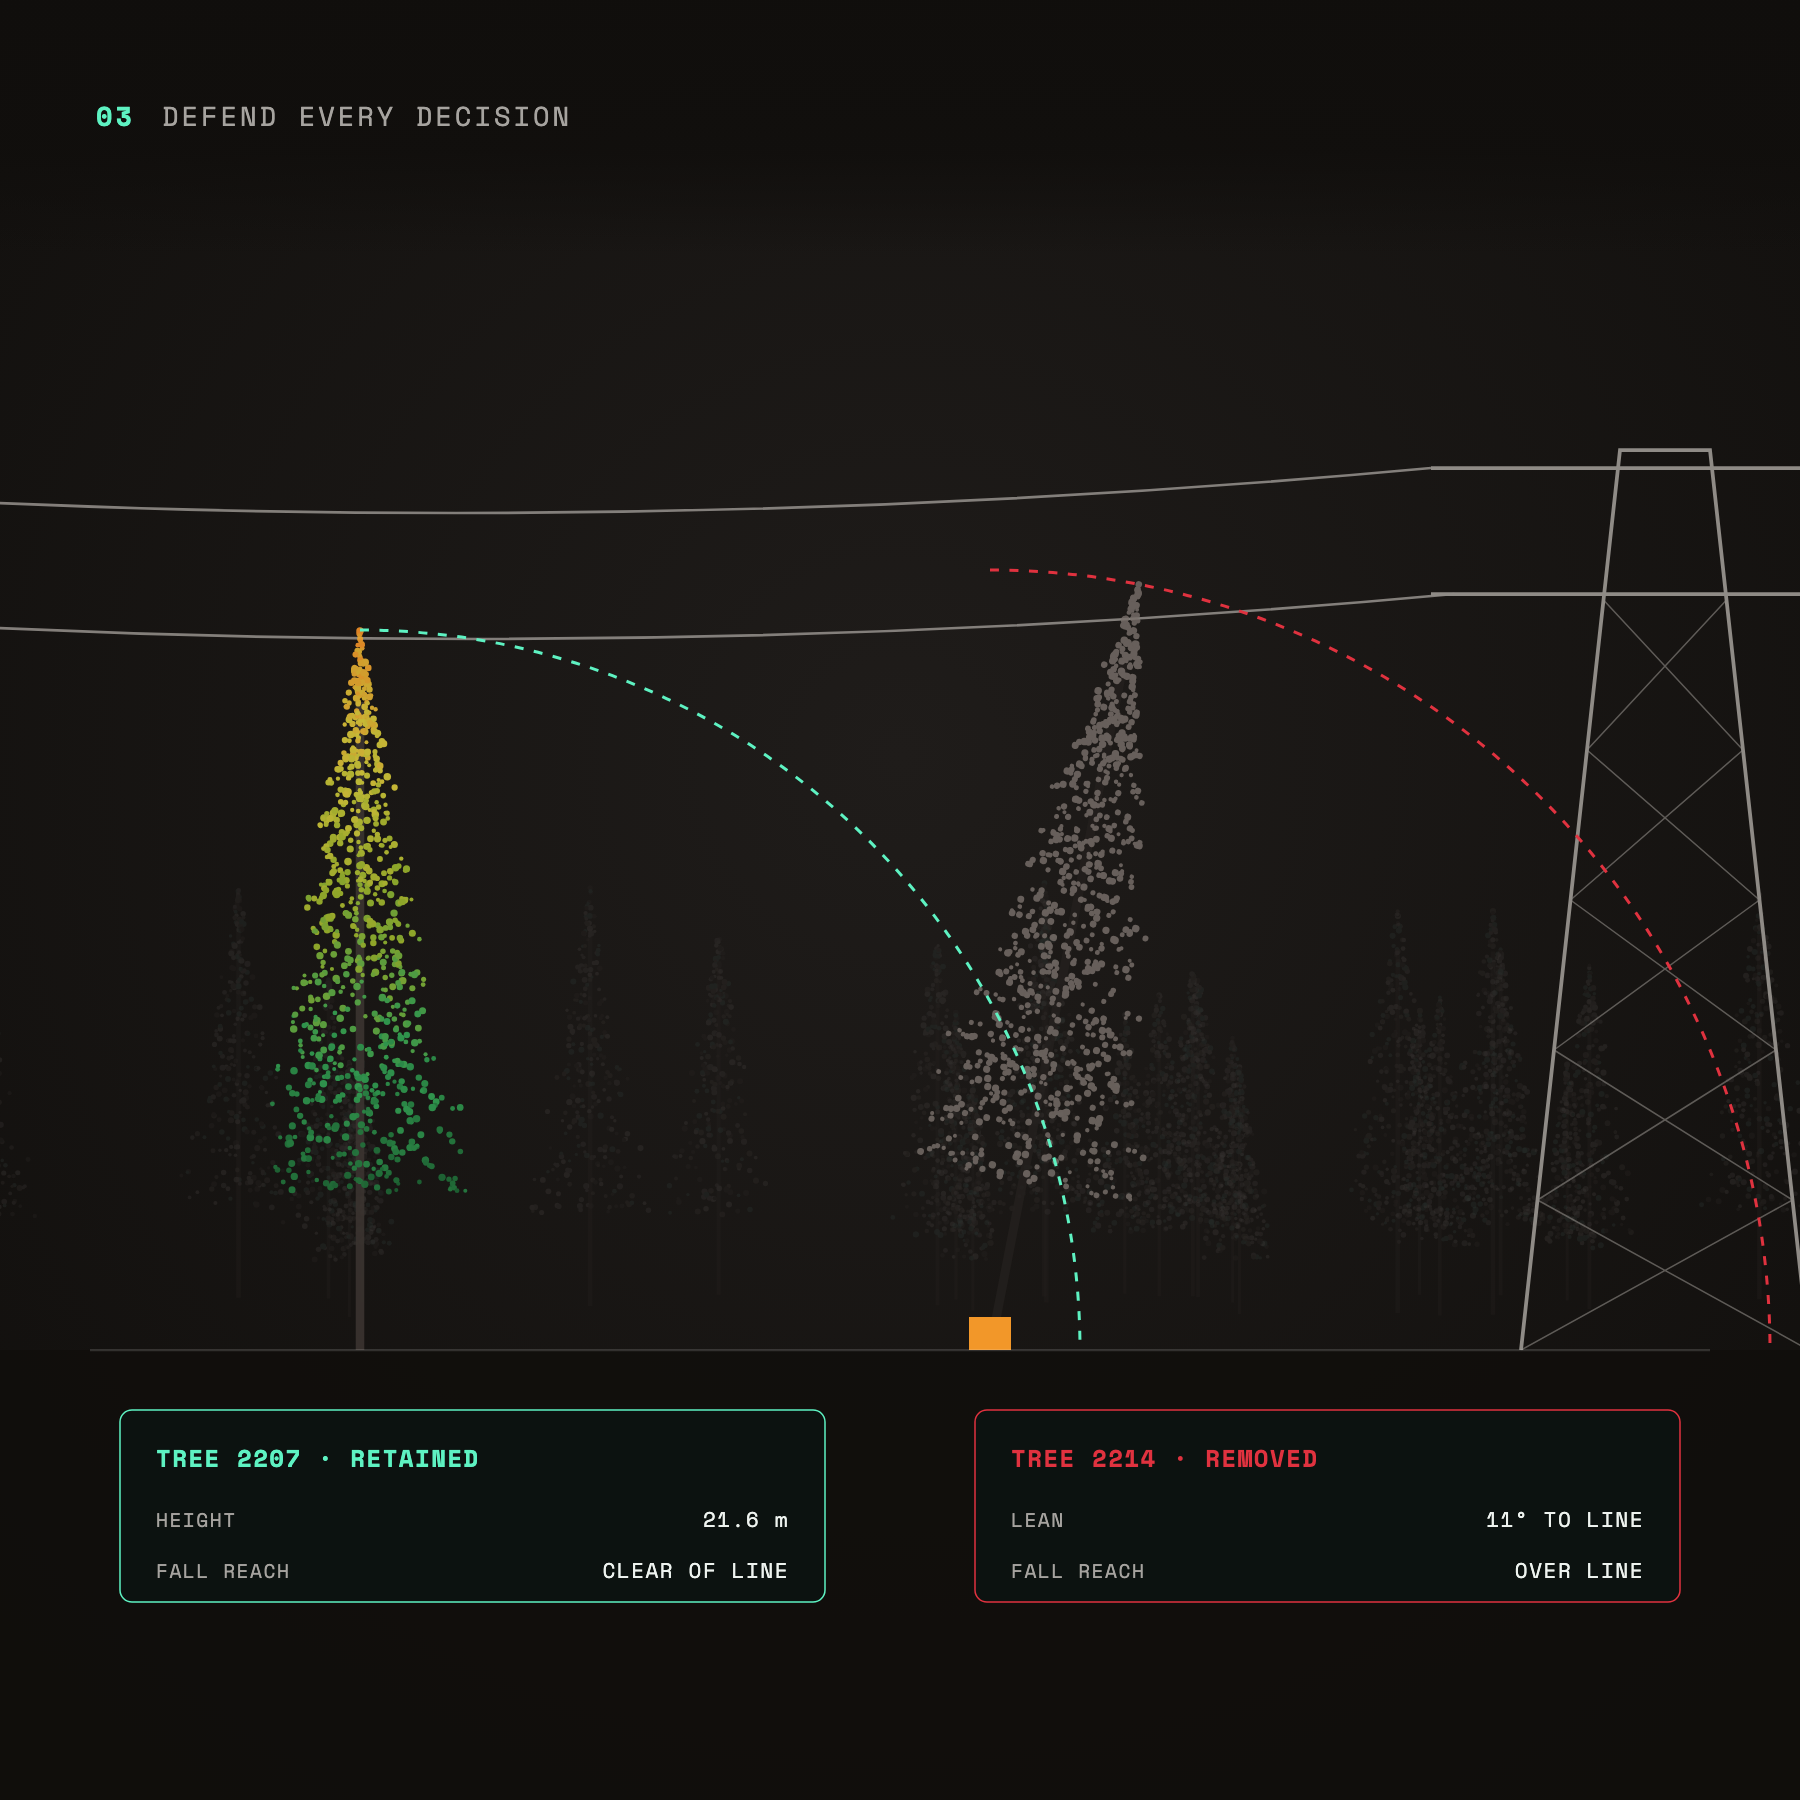
Defend every decision: one tree retained because its fall reach clears the line, another removed because it leans over the line
Defend every decision
Per-tree evidence of why a tree came down and why the others stayed.
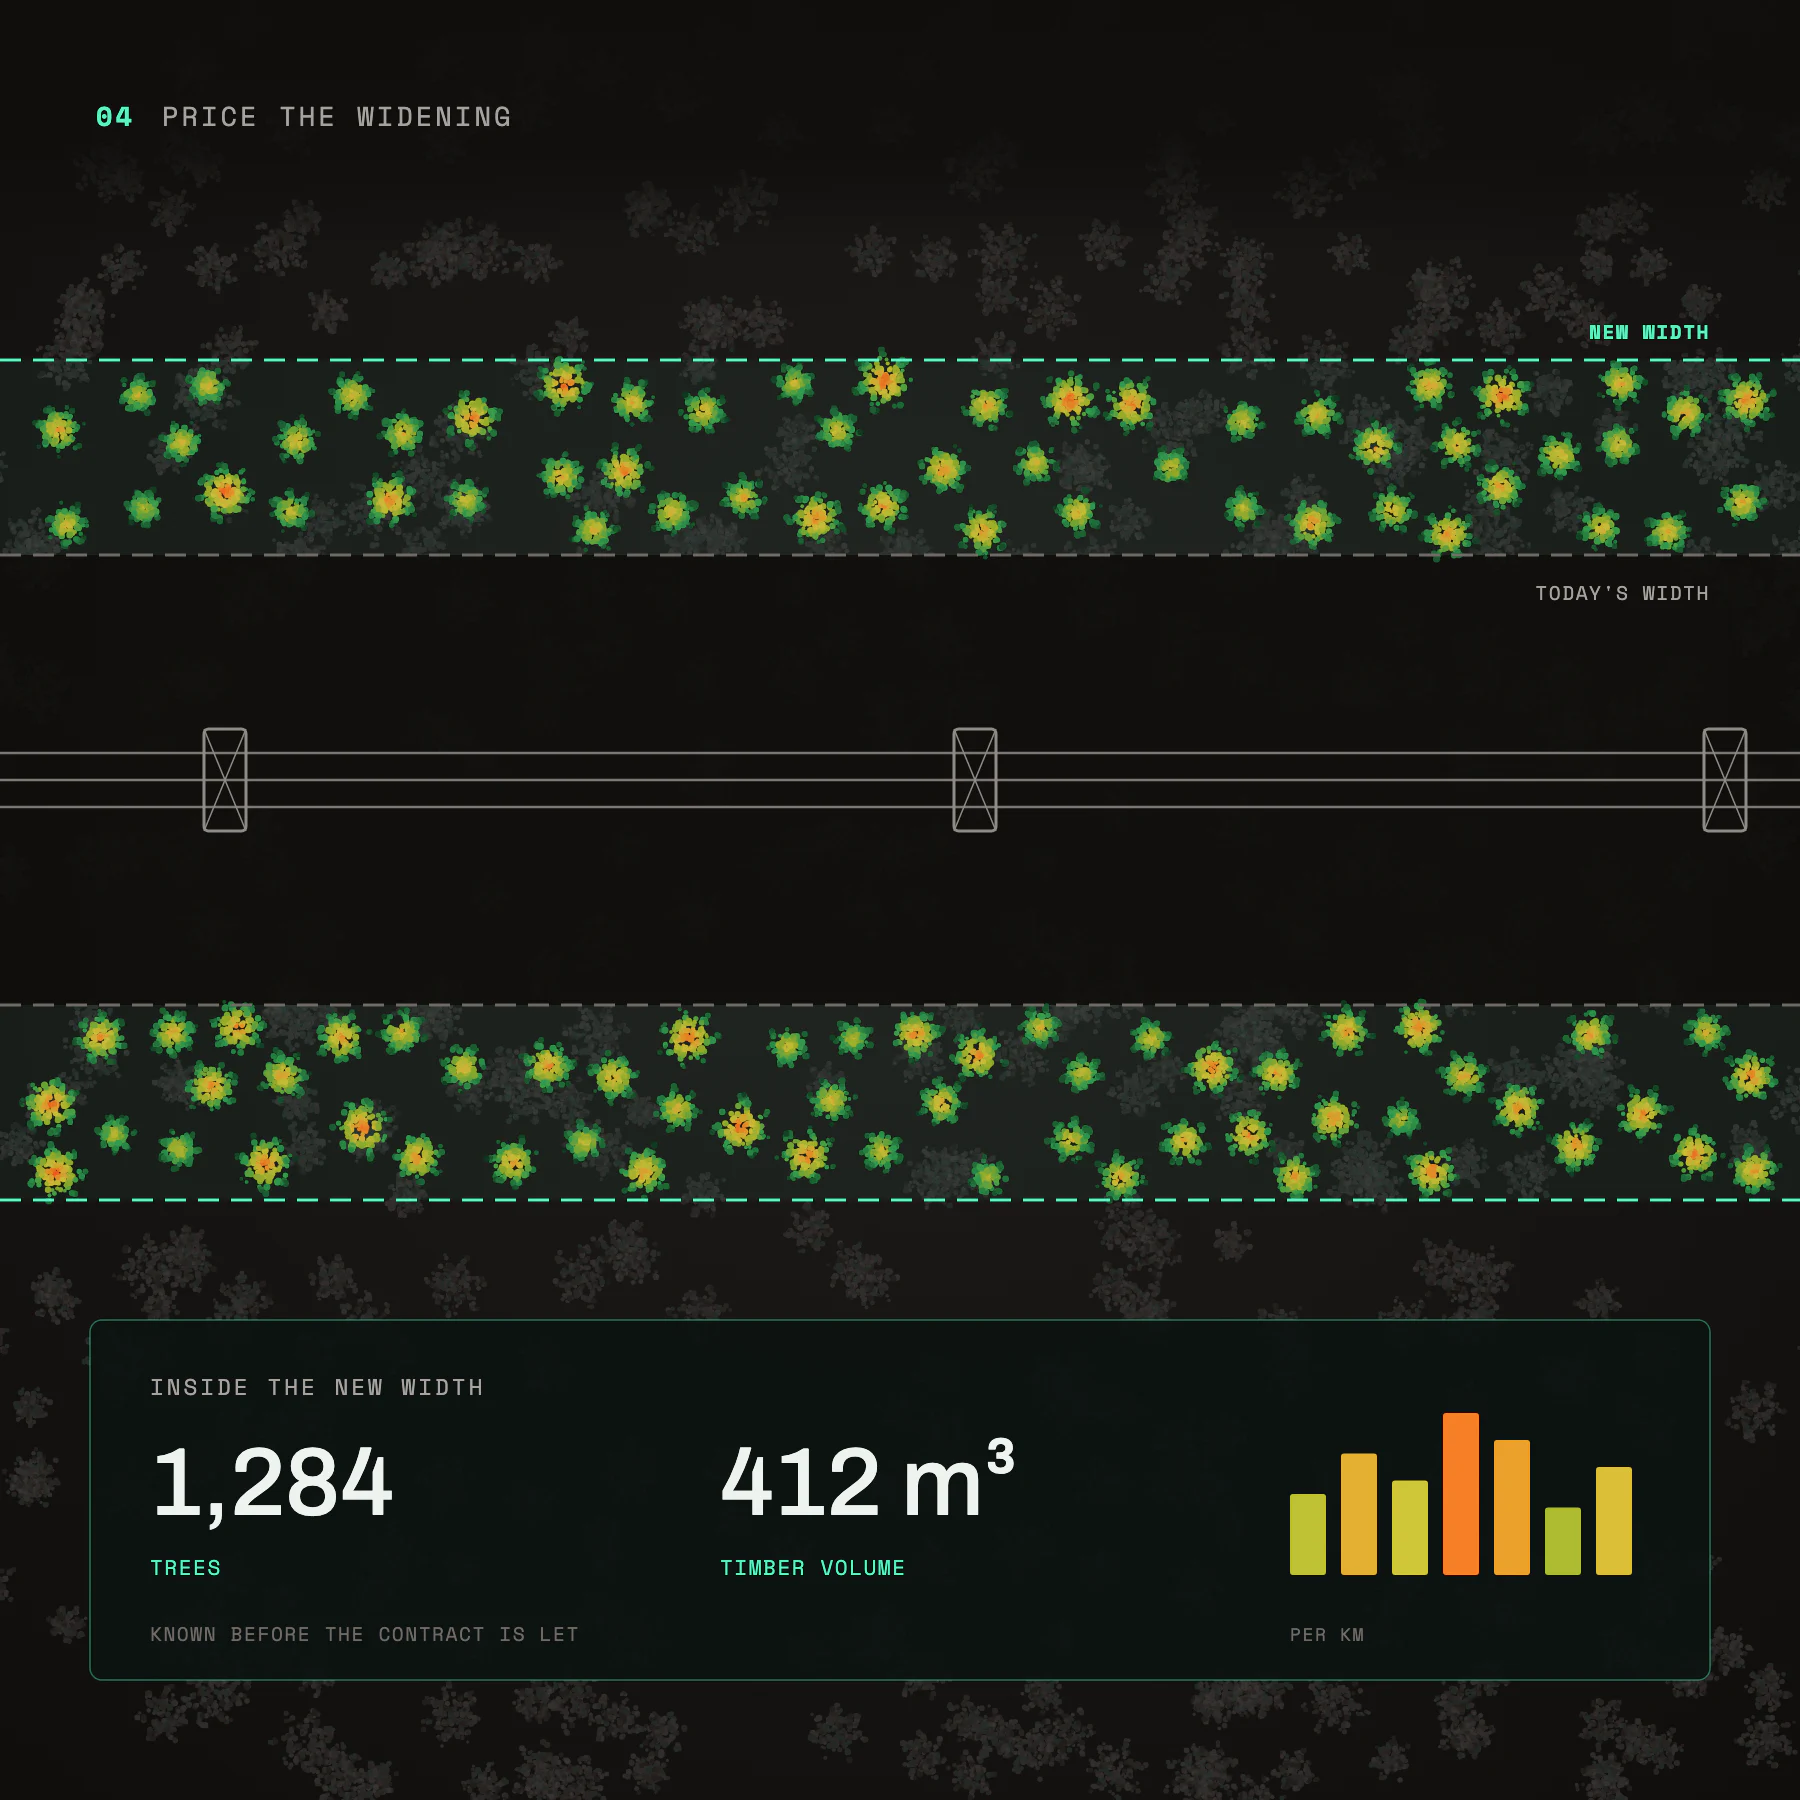
Price the widening: 1,284 trees and 412 cubic metres of timber measured inside a wider power line corridor
Price the widening
Know the trees and timber volume inside a new corridor width before the contract is let.
Clear up with a number: felled stems on the ground measured at 3.97 cubic metres of timber
Find all the downed logs
Measure the timber left on the ground instead of estimating it by eye.
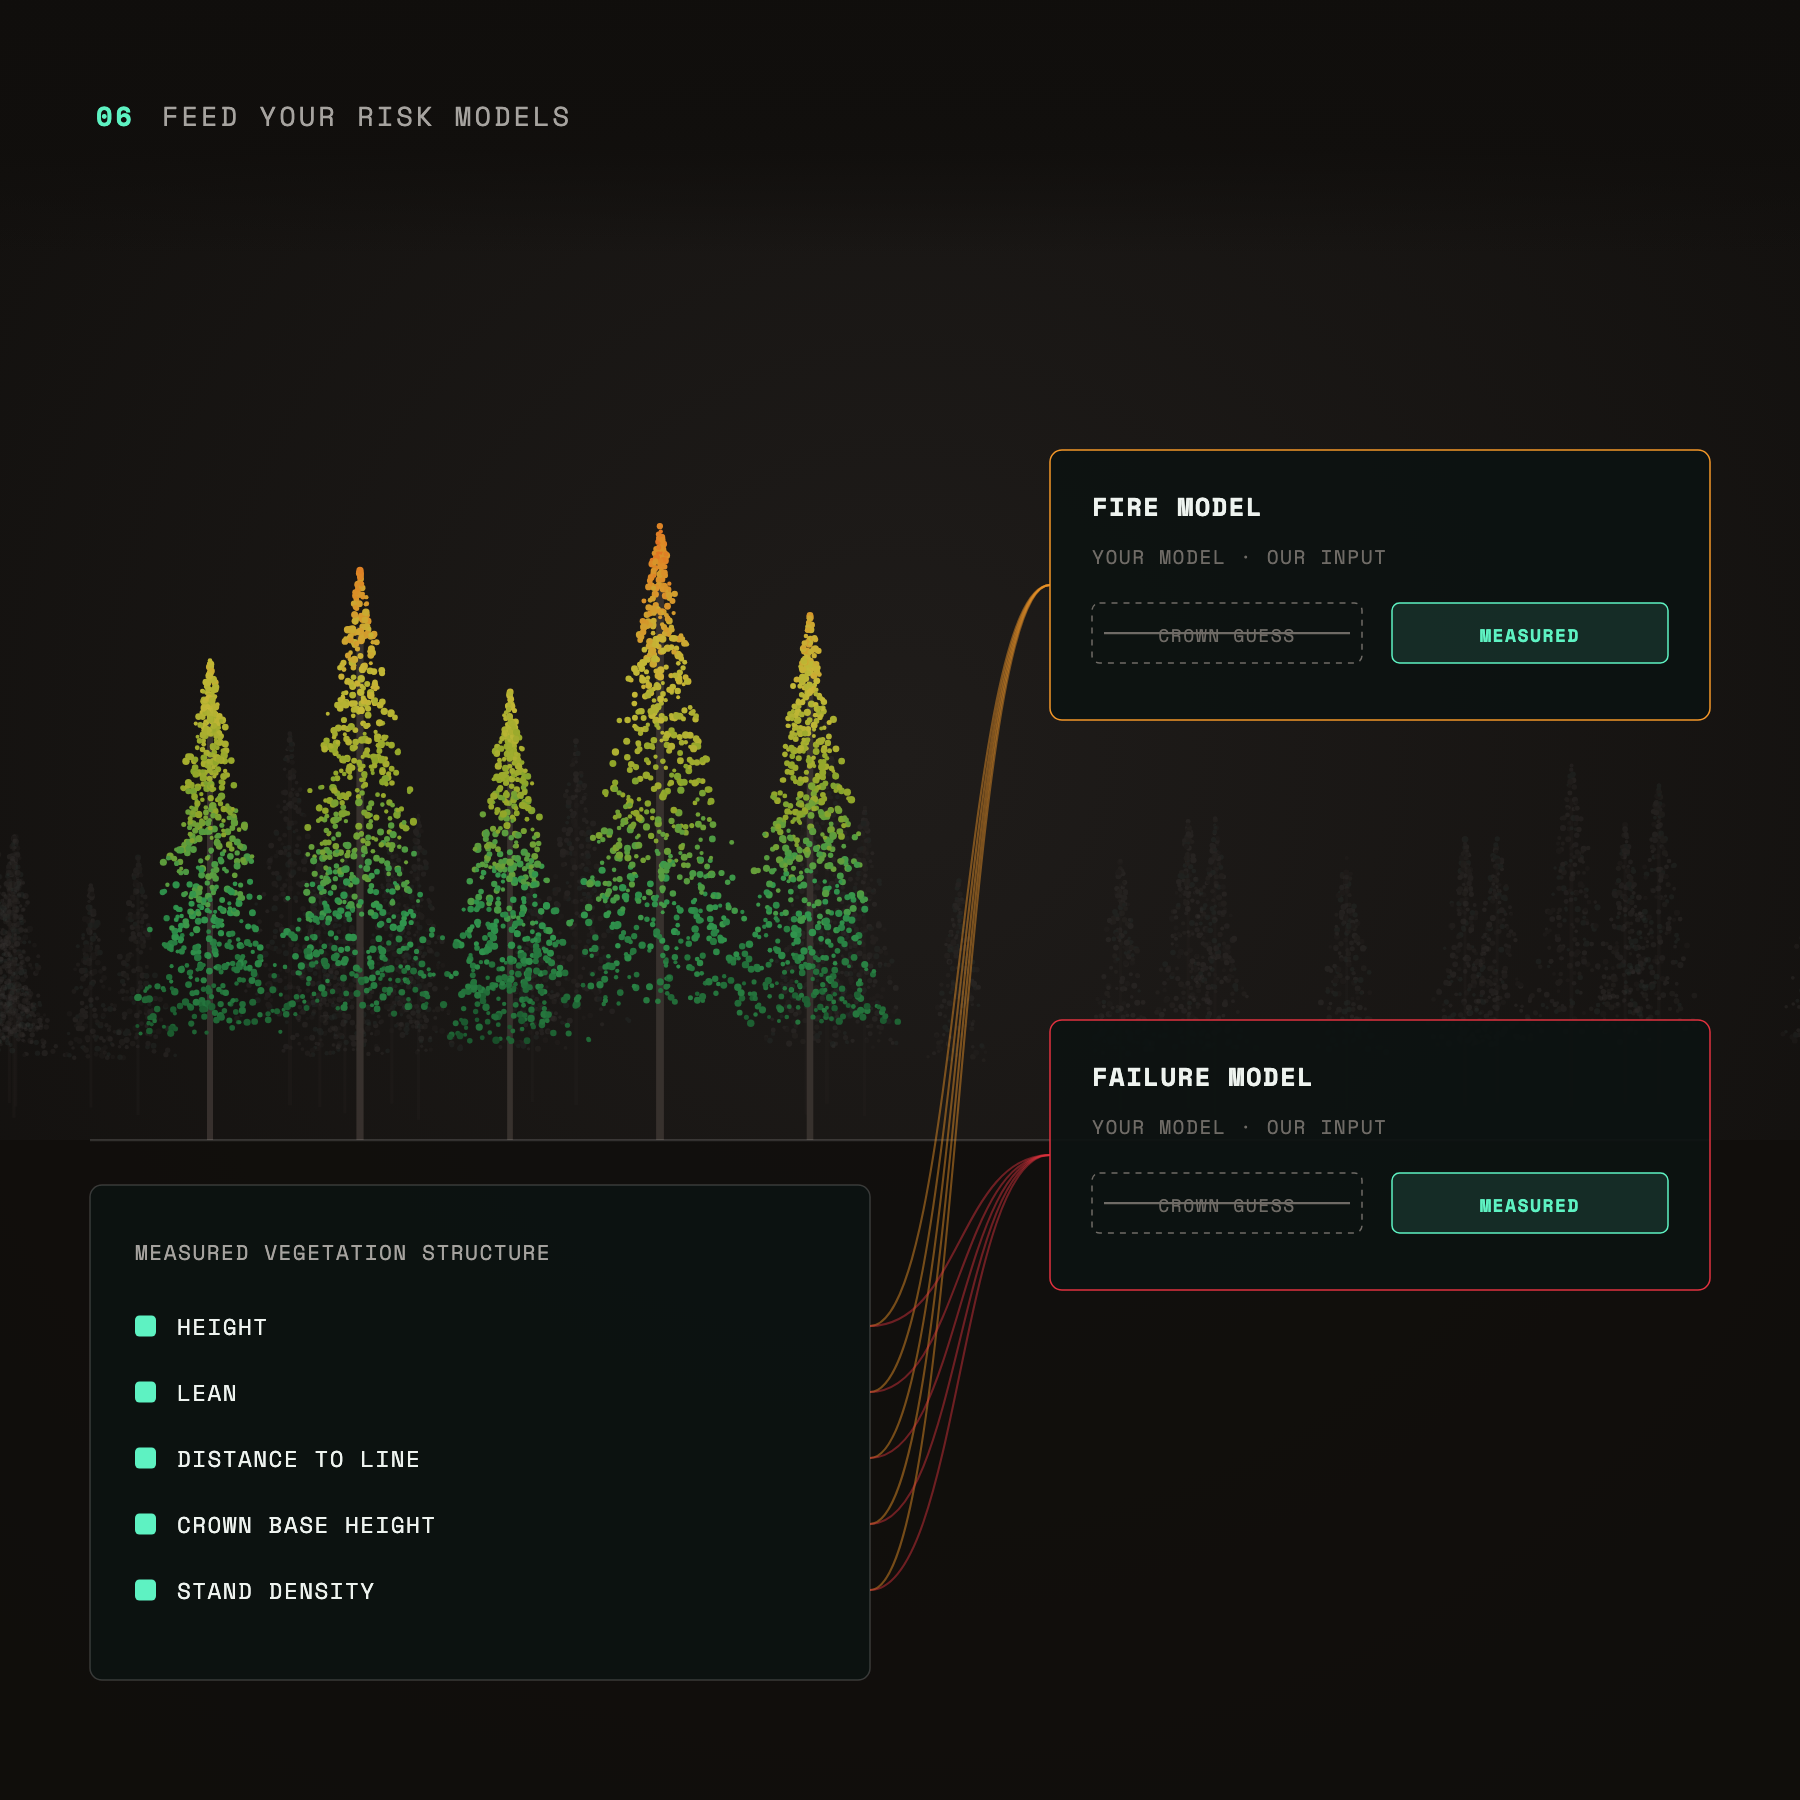
Feed your risk models: measured height, lean, distance to line, crown base height and density feeding fire and failure models
Feed your risk models
Measured vegetation structure as an input to your fire and failure models, in place of crown-level guesses.
get started now

Pick a span.
Leave with a crew list you can defend.