Plantation yield

Scroll to learn more
THE Problem

Every tree counts.
Nobody counts every tree.

Sampled
Counts are walked, sampled and scaled up.
Field teams count and measure a sample of rows and extrapolate across the block. On estates of tens of thousands of hectares, that sample is a sliver.
Hidden losses
A missing tree is lost yield nobody sees.
Trees die, fail to establish or are never replanted. Each gap is yield lost for years, and from the air a closed canopy hides it.
Seen from above
Crowns merge; stems disappear.
Satellite and above-canopy imagery see a carpet of crowns. Where the canopy closes, telling trees apart, let alone measuring their stems, gets unreliable.
Averaged forecasts
Harvest is forecast from averages.
Yield and volume forecasts lean on planted density and growth tables, not on what is actually standing in each block.
Short-handed
Counting by hand is slow and costly.
Every manual count ties up field teams for weeks, and it has to be repeated every season.
Remote
The estates with the most trees have the least signal.
Tools that need a connection in the field don't work across remote plantations.
From capture to value

From a corridor scan to a crew list you can defend.

The world first
‍end-to-end physical AI in Nature

What you receive

For every tree, every block and the whole estate.

Per tree
Number
An ID for every tree, kept in the tree register.
Position
Location and ground elevation.
Height
From the terrain model.
Stem
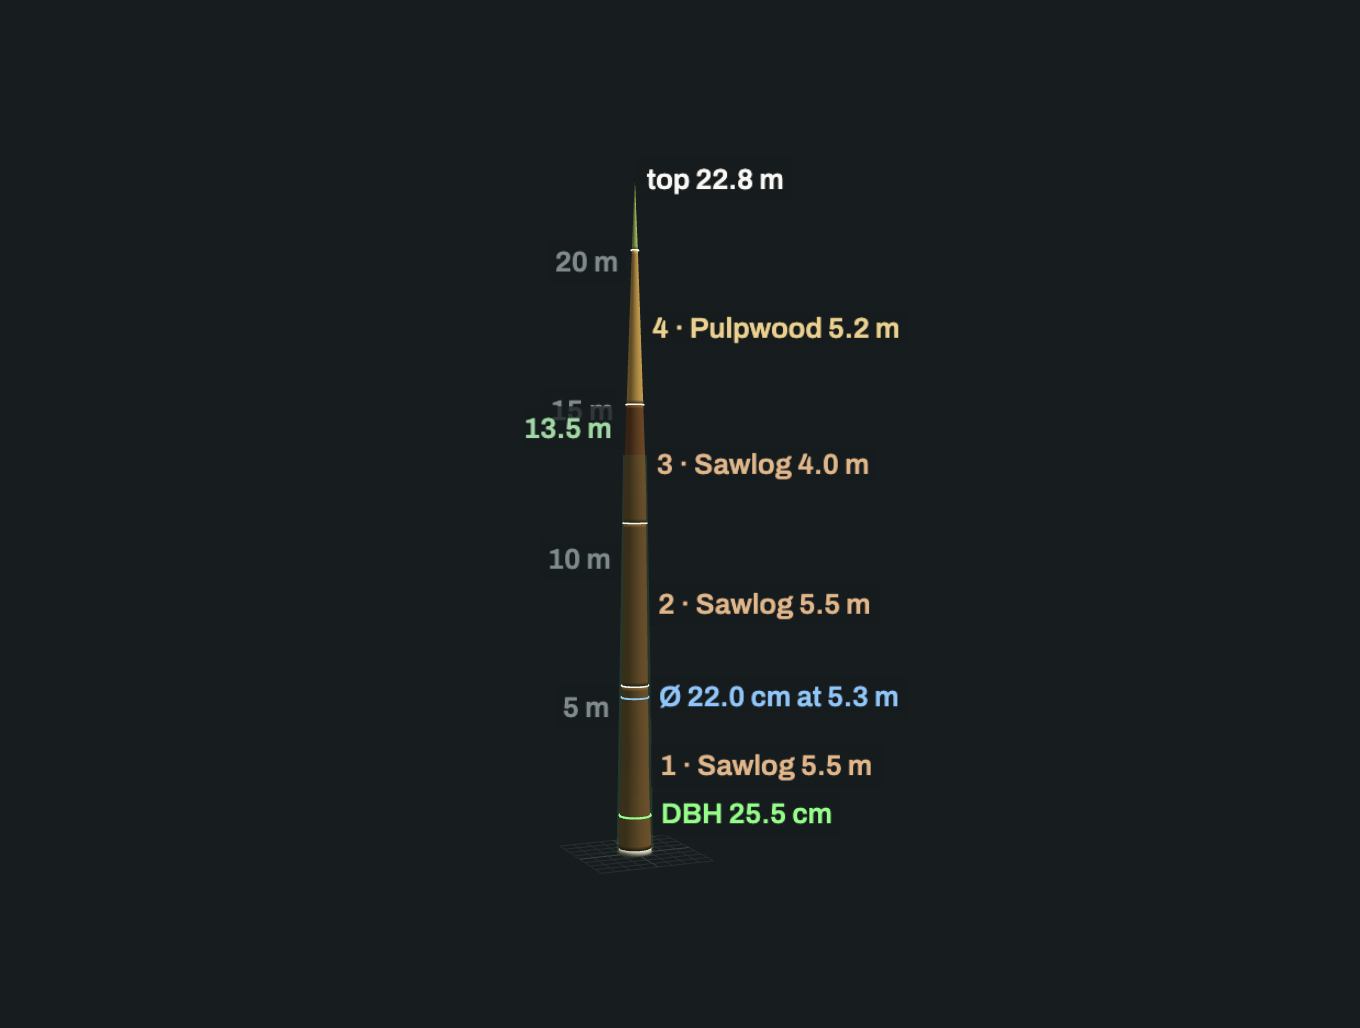
DBH, stem curve and volume, for stem plantations.
Fruit
Bunch count and a ripeness grade per bunch, for fruit crops (built with you).
Verdict
How well it was seen, and whether it is reliable.
Per block
Count
Trees, and trees per hectare.
Gaps
Missing trees against planted density or design.
Structure
Height distribution; basal area and volume per hectare for stem plantations.
Harvest-ready
Trees with ripe fruit, mapped for the harvest round (fruit crops).
Change
Survival and growth between surveys.
Files and application
Map layers
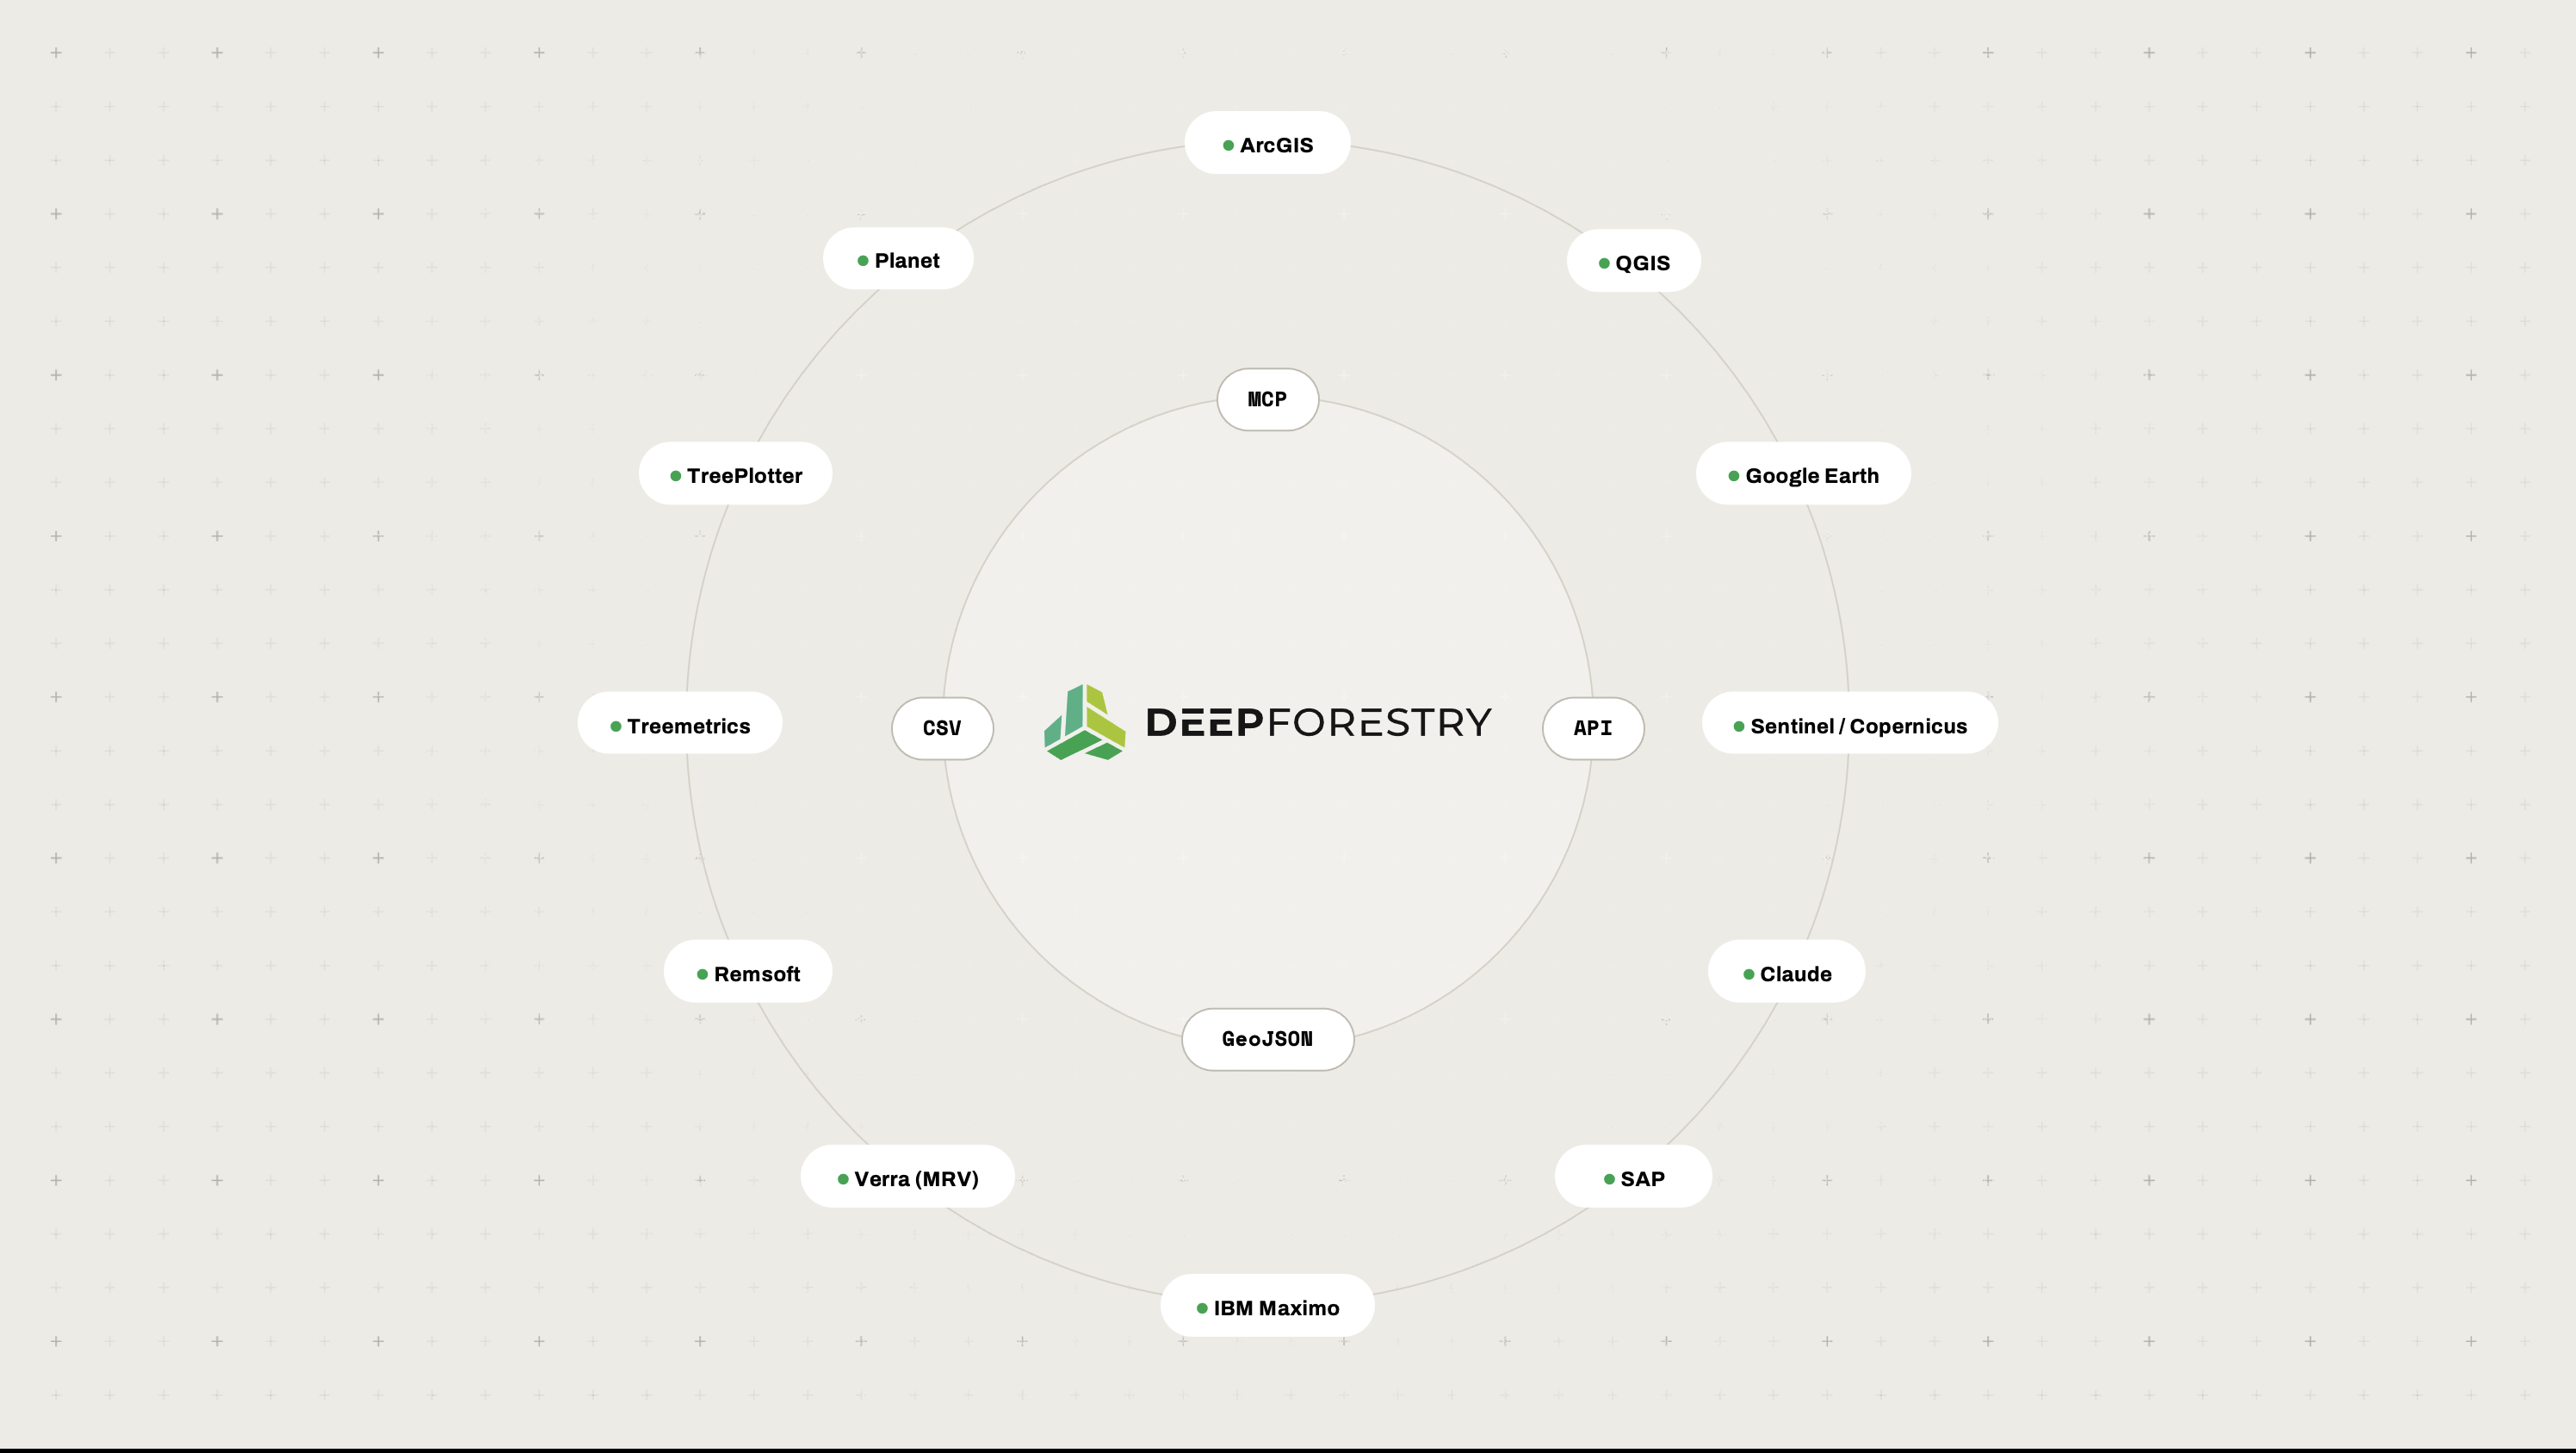
Tree register with positions and per-tree results (GeoJSON, CSV), block statistics.
Terrain and cloud
GeoTIFF terrain model, LAS/LAZ point cloud.
Application
Block heat maps of count, gaps, height, volume and ripeness.
Outcomes

The right trees first,
and the reasons on record.

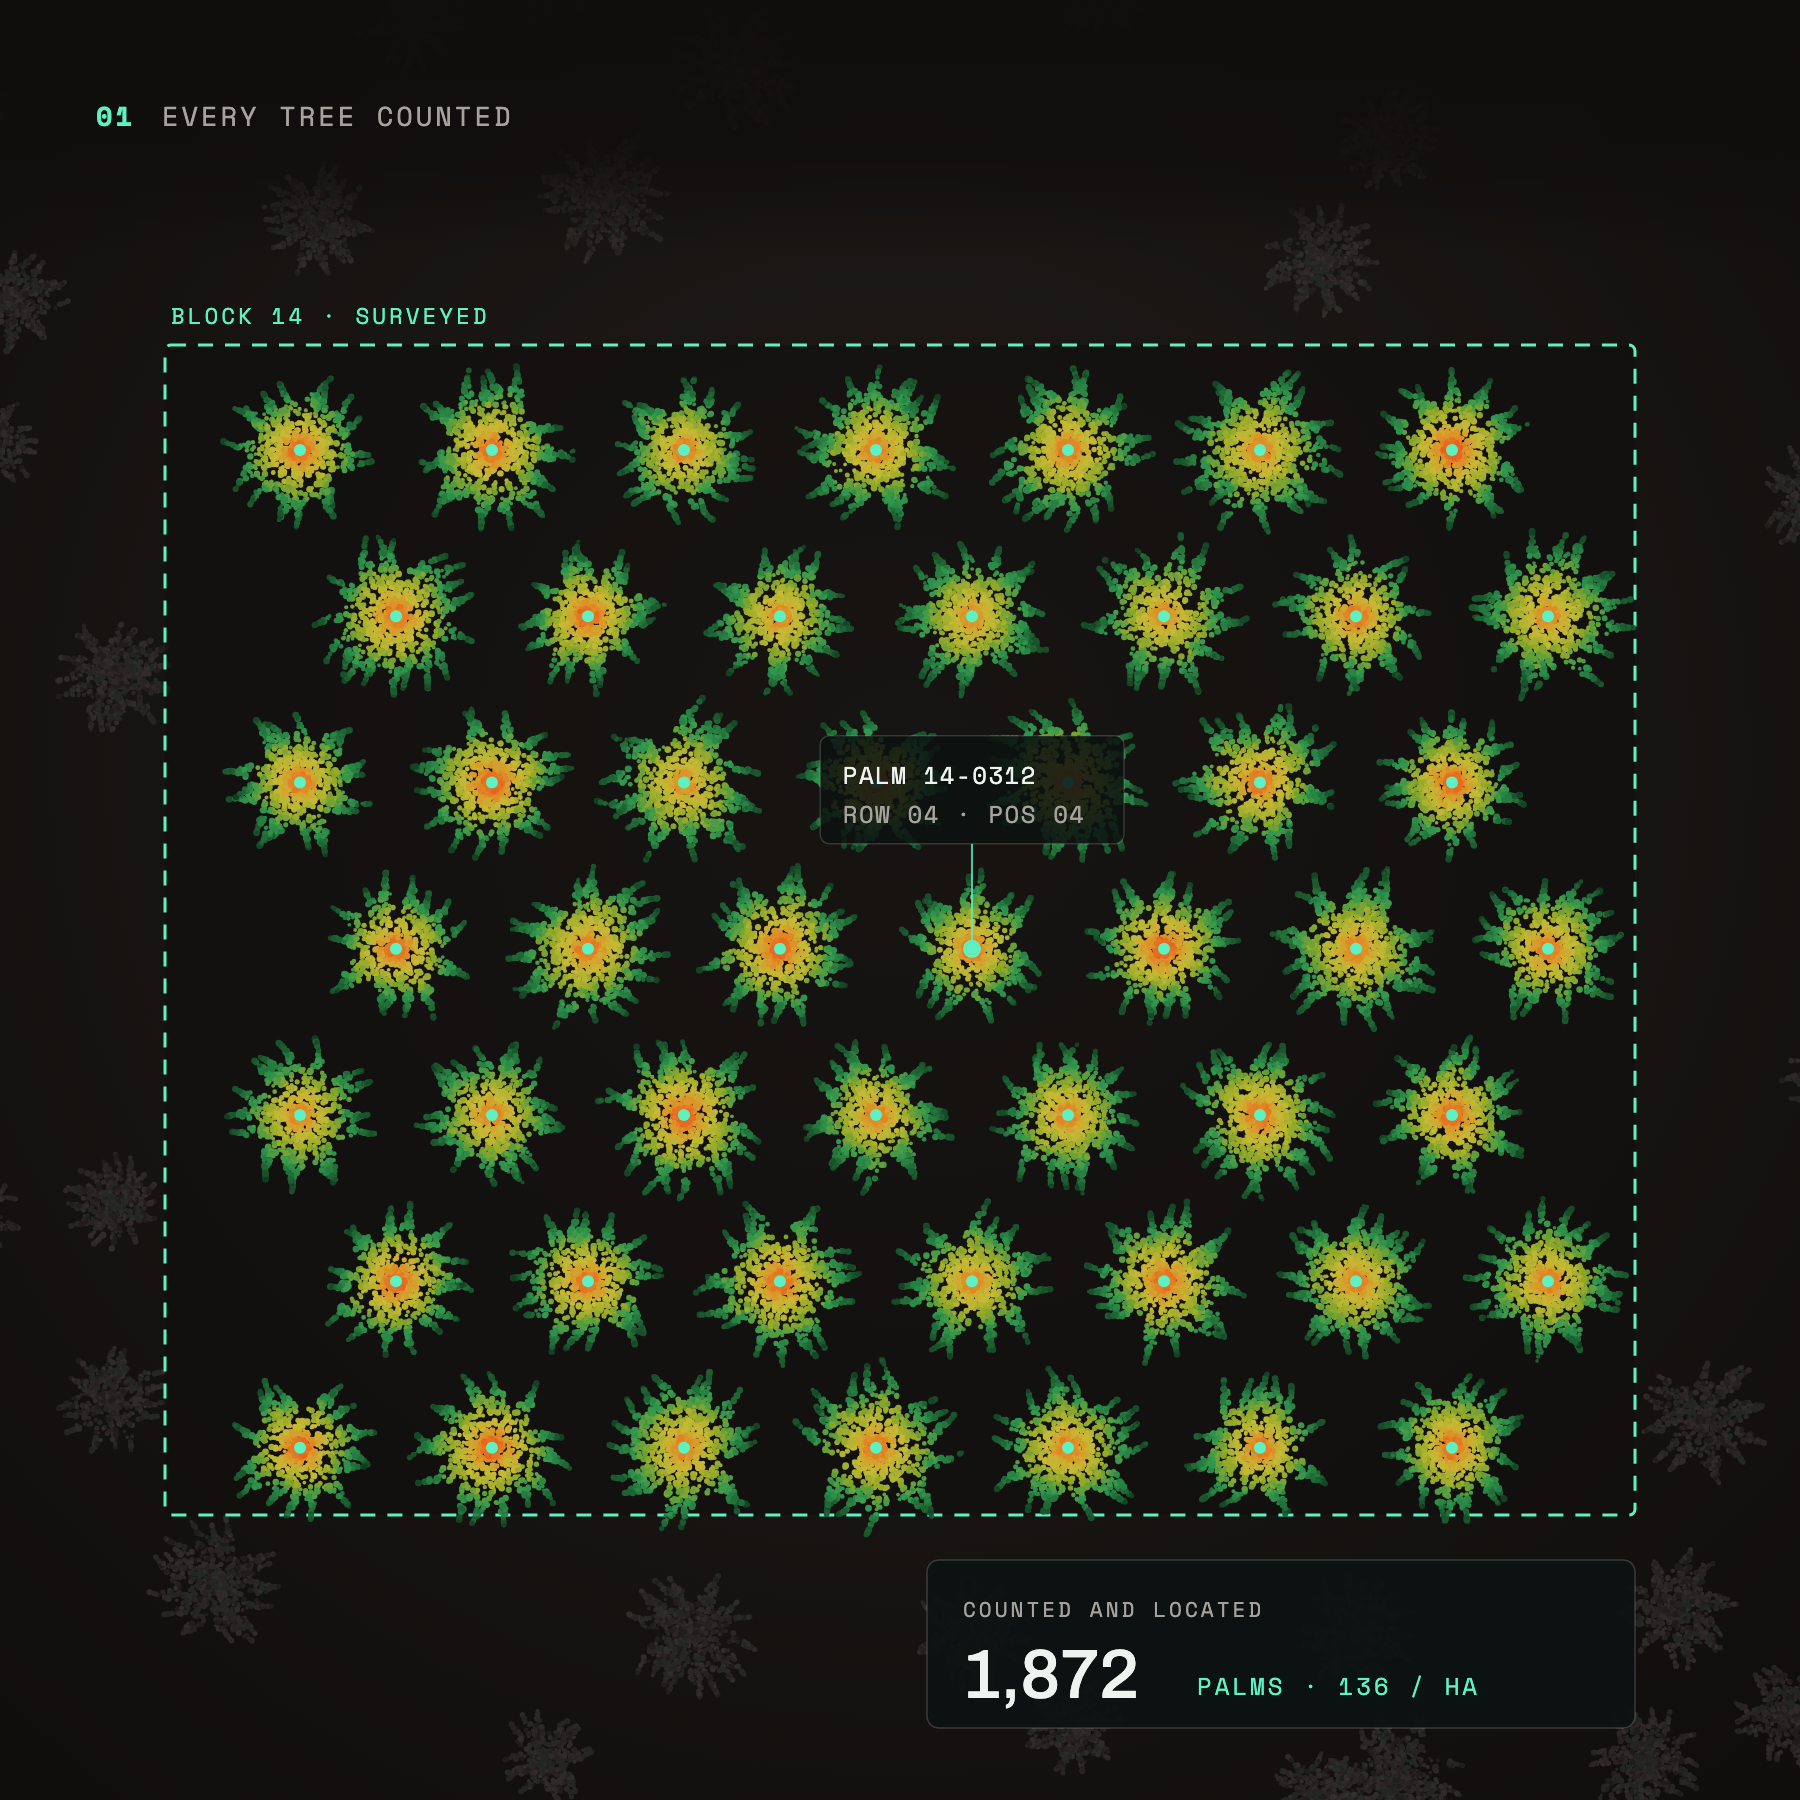
Every tree counted: 1,872 palms located in plantation block 14, about 136 per hectare
Every tree counted
Every palm in the block counted, located and numbered, not sampled rows scaled up.
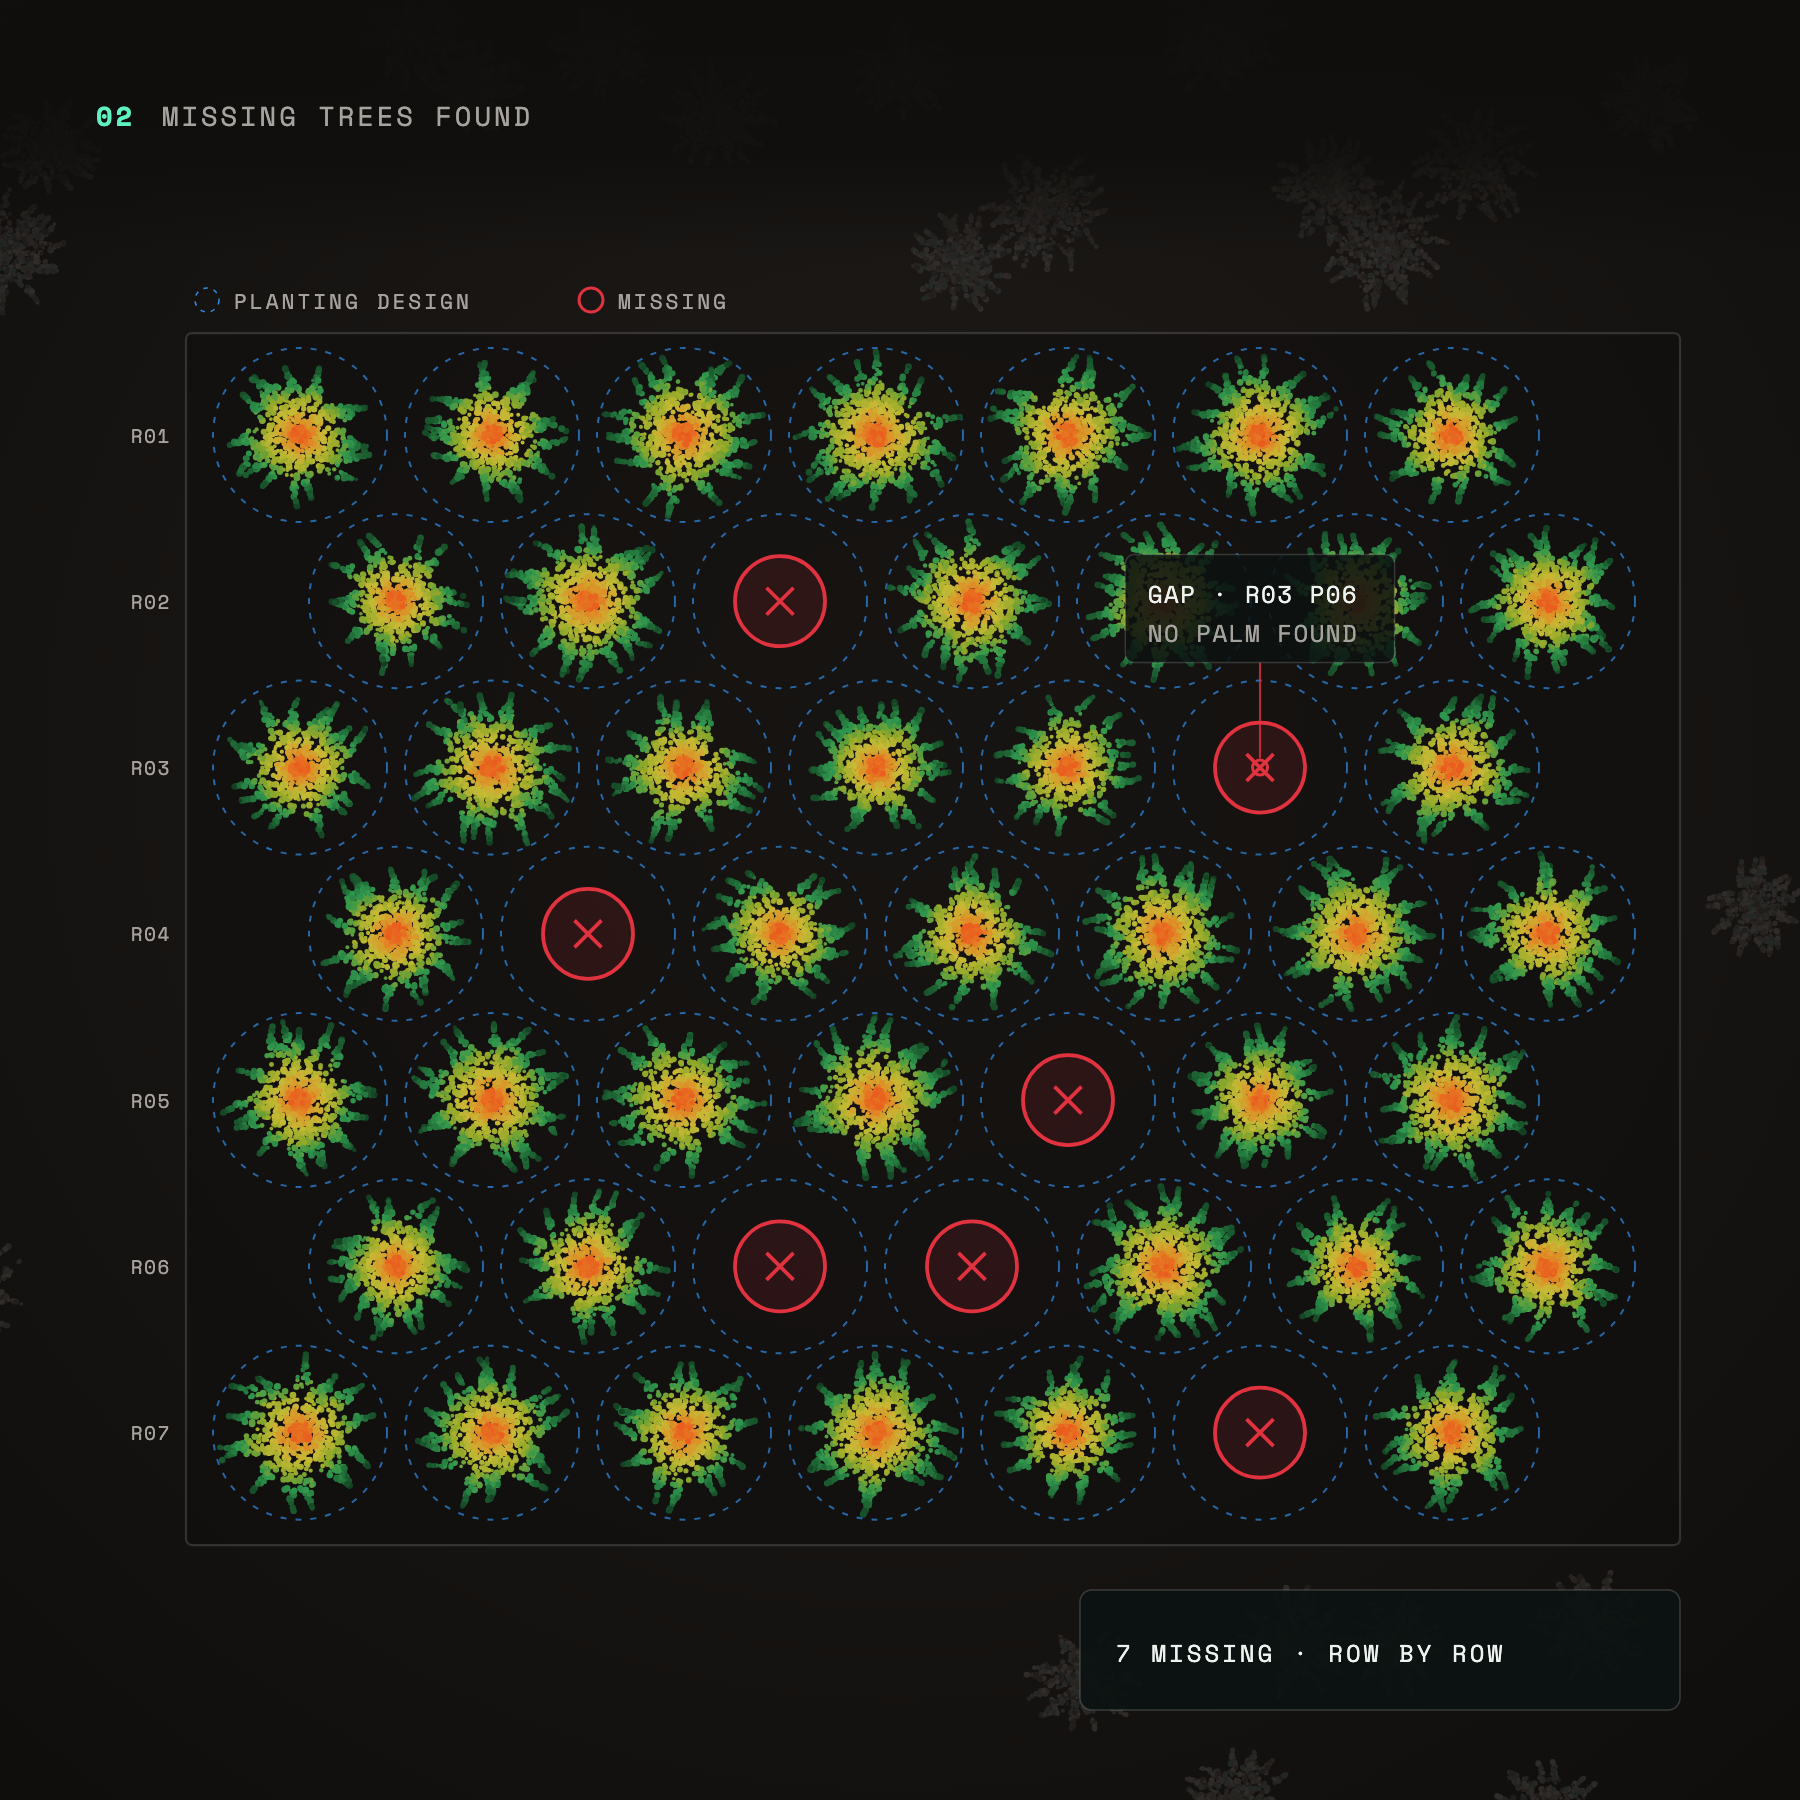
Missing trees found: planting grid with 7 missing palms marked row by row
Missing trees found
Located trees laid over your planting design show every gap, row by row, even under a closed canopy.
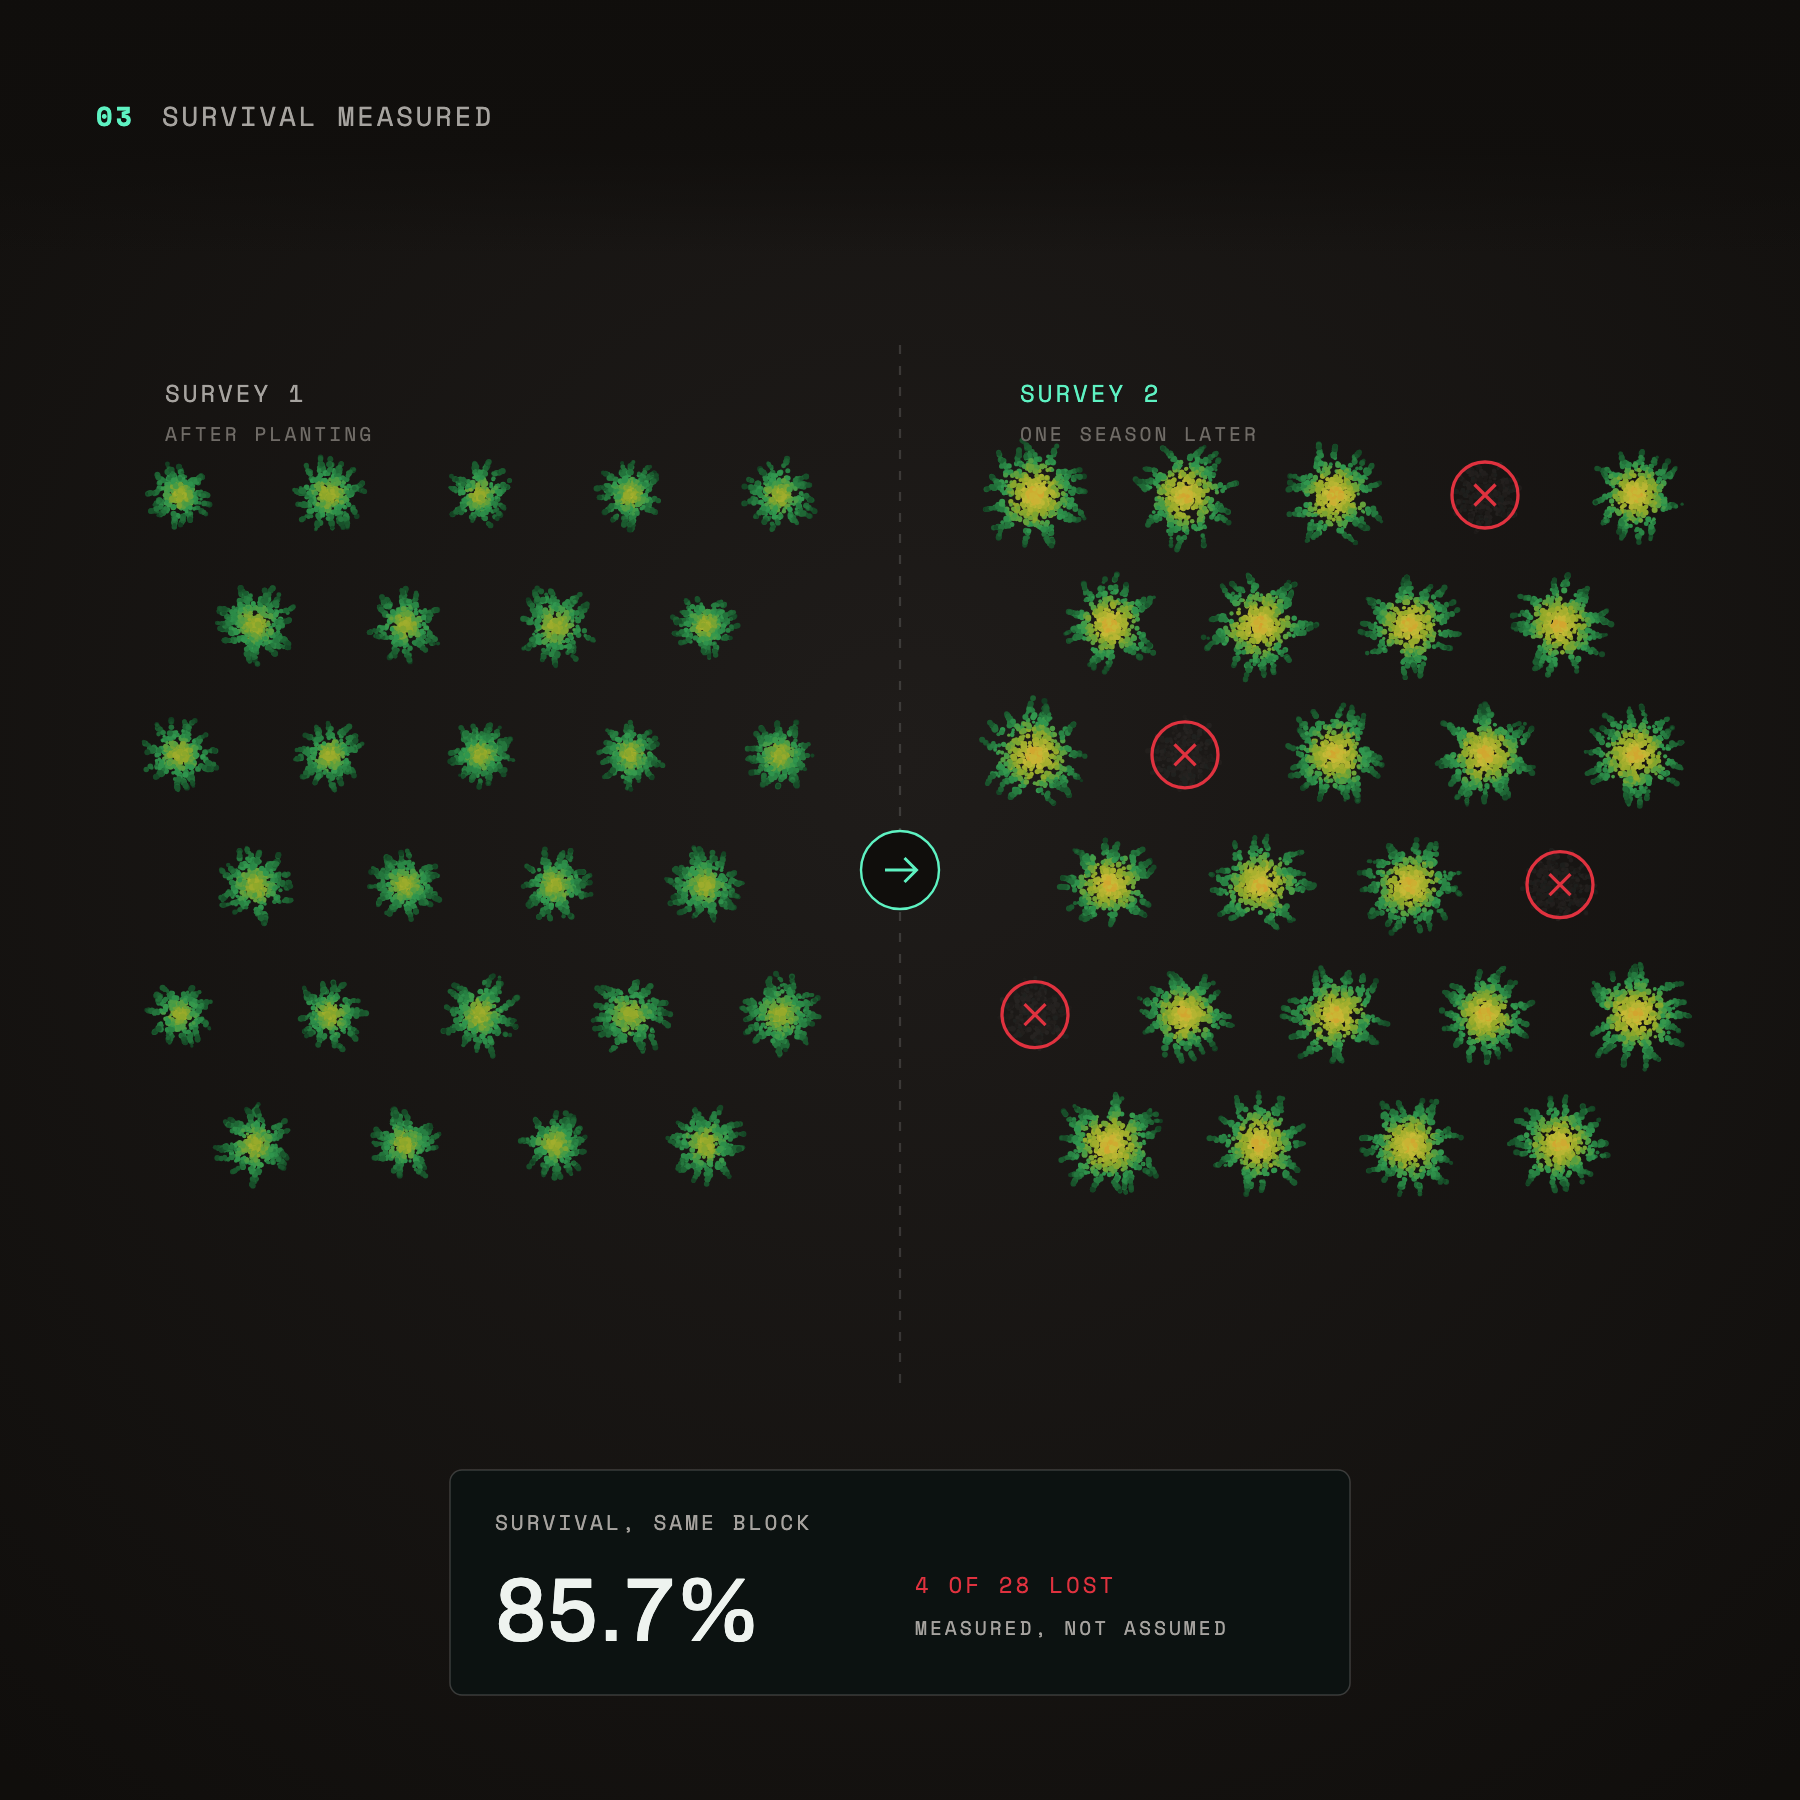
Survival measured: same block after planting and one season later, 85.7% survival
Survival measured
Survey the same block again and see which trees survived. It’s measured, not assumed from planting records.
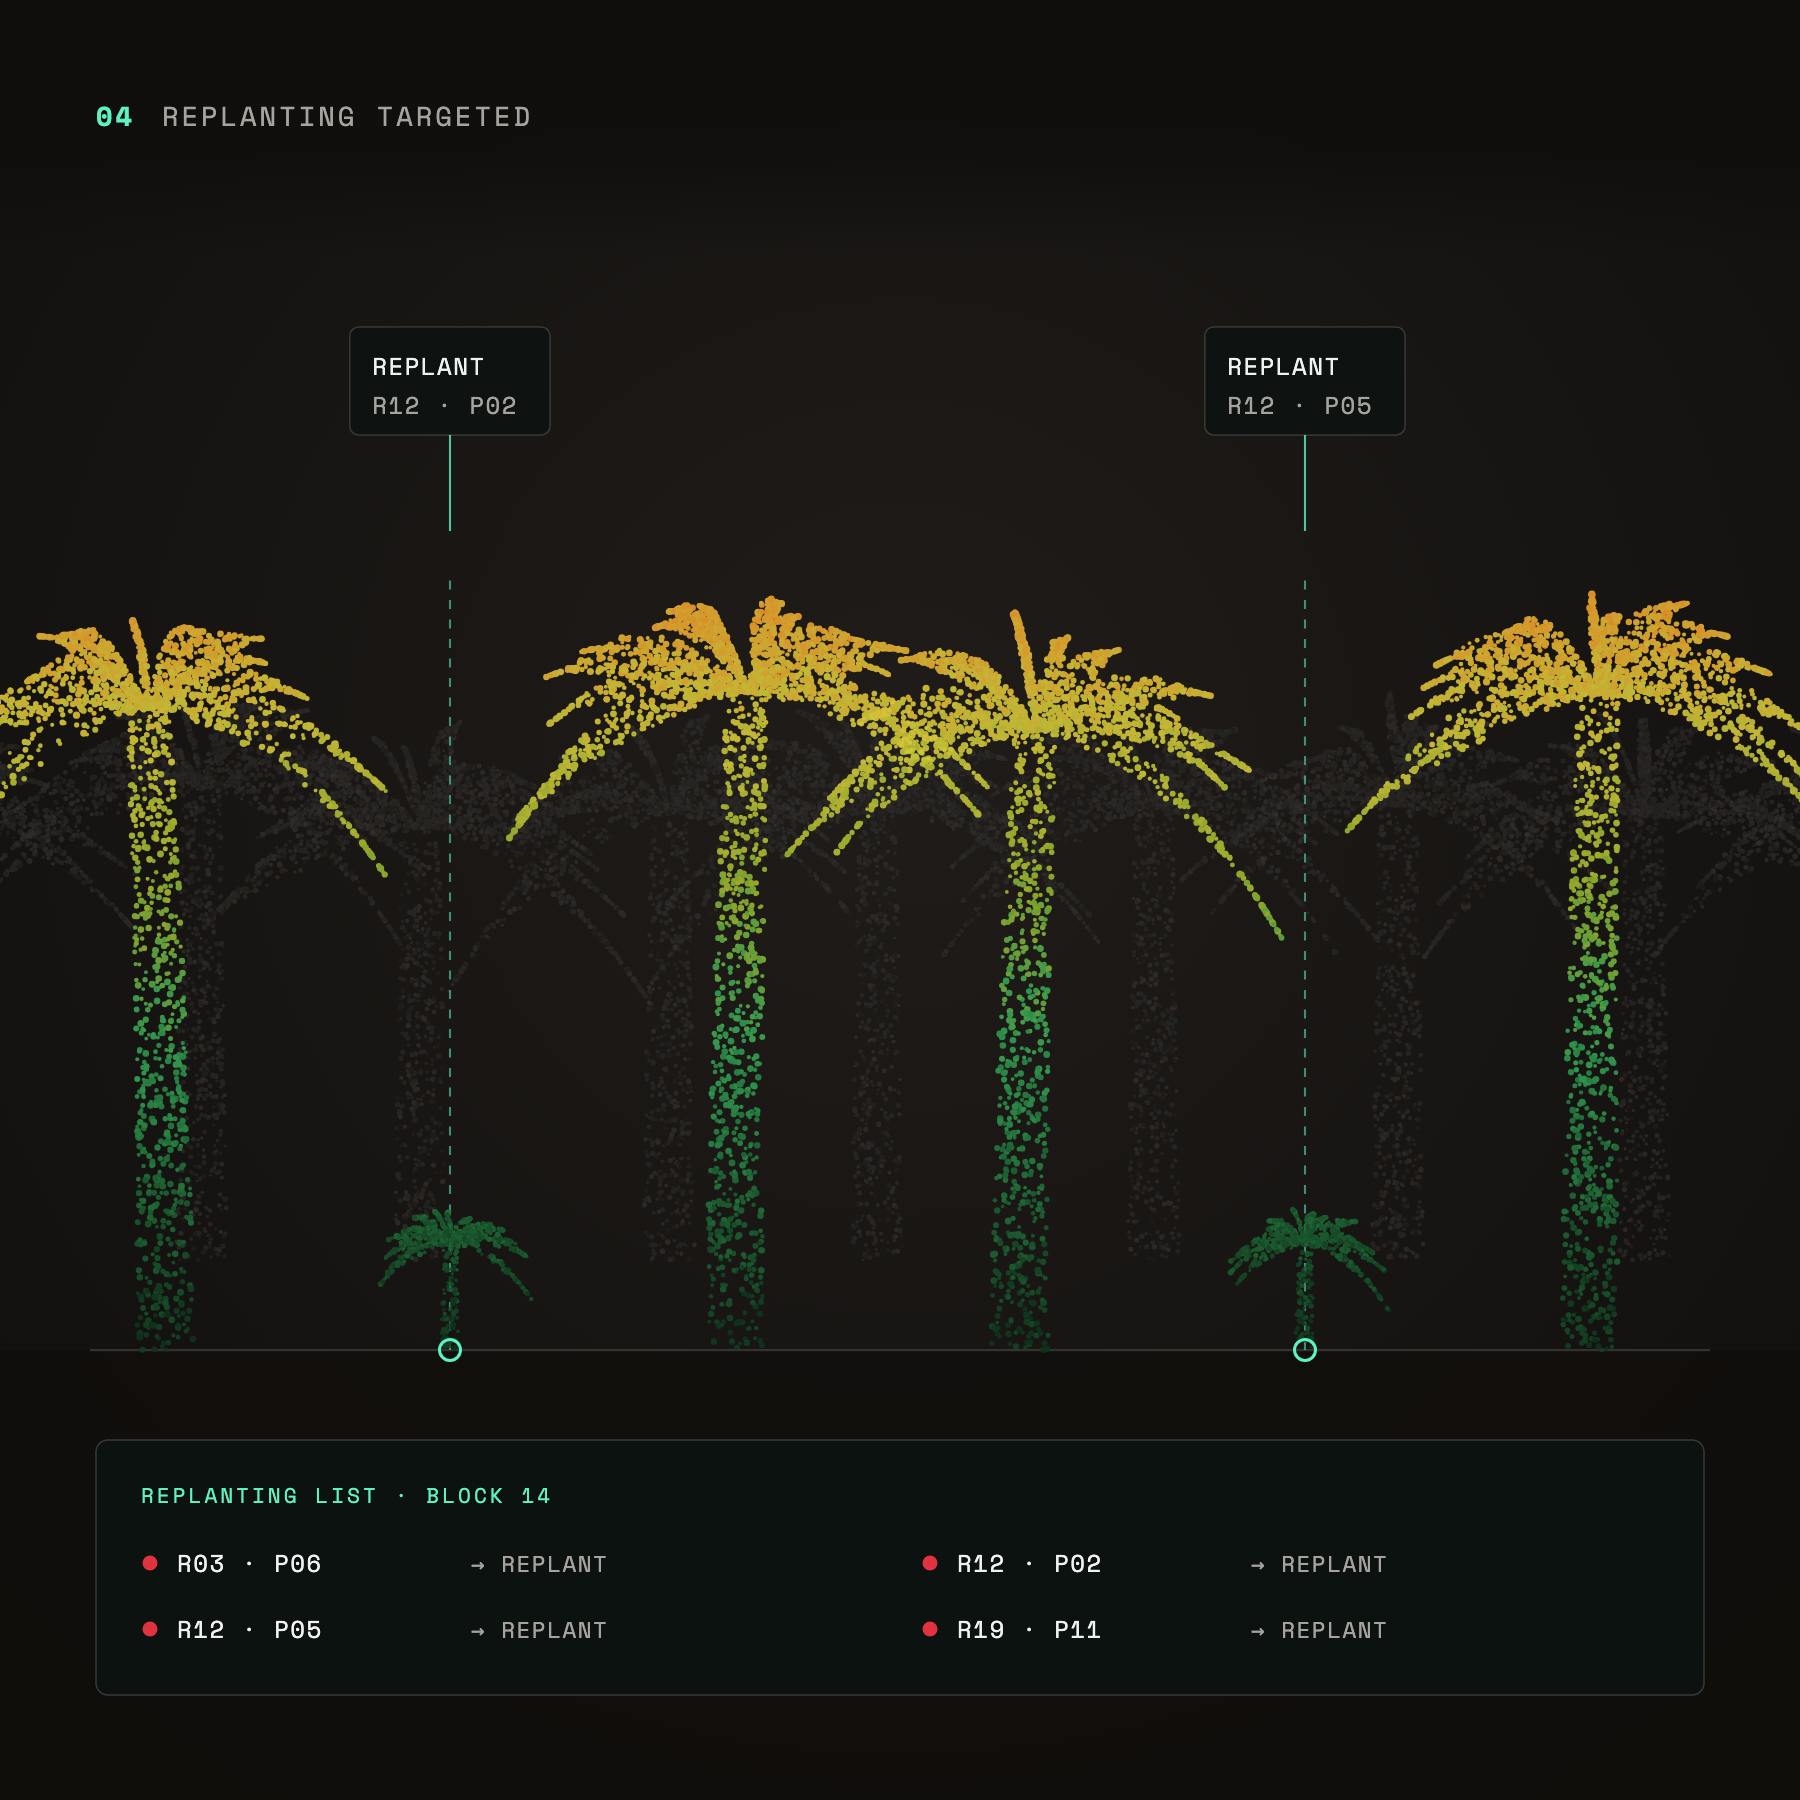
Replanting targeted: gaps between palms located by row and position on a replanting list
Replanting targeted
Every gap becomes a row and position on a replanting list, so crews go straight to it.
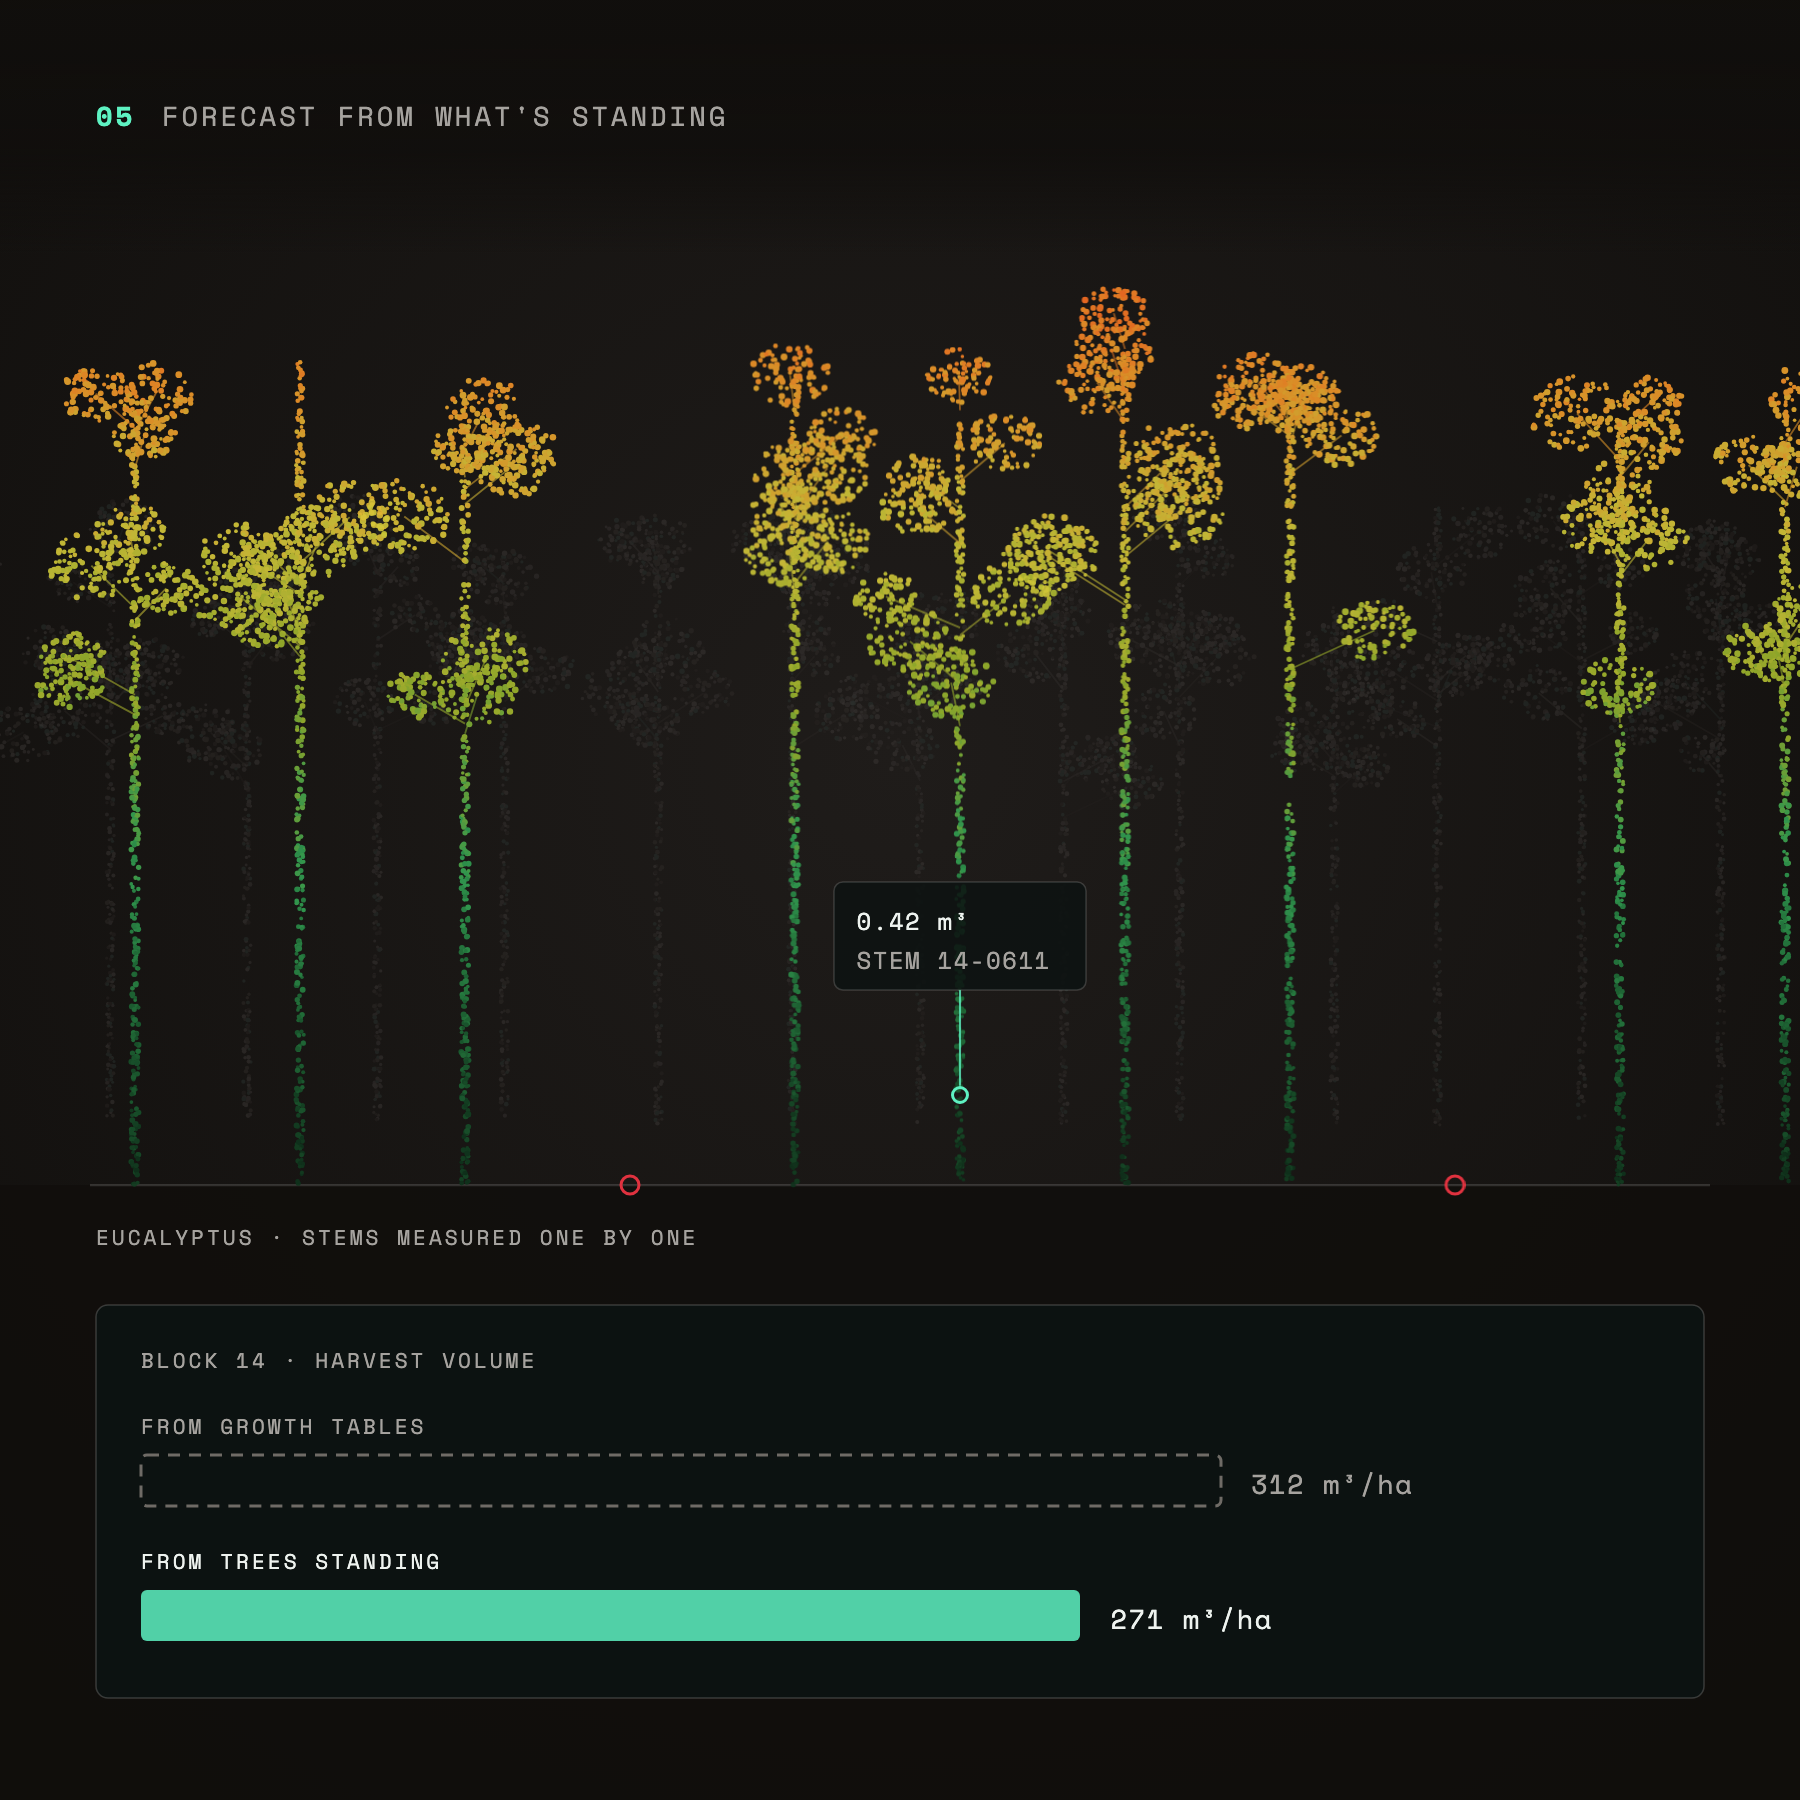
Forecast from what's standing: eucalyptus stems measured one by one, giving 271 cubic metres per hectare against 312 from growth tables
Forecast from what’s standing
Harvest volume rolled up from the trees actually measured, not from growth tables.
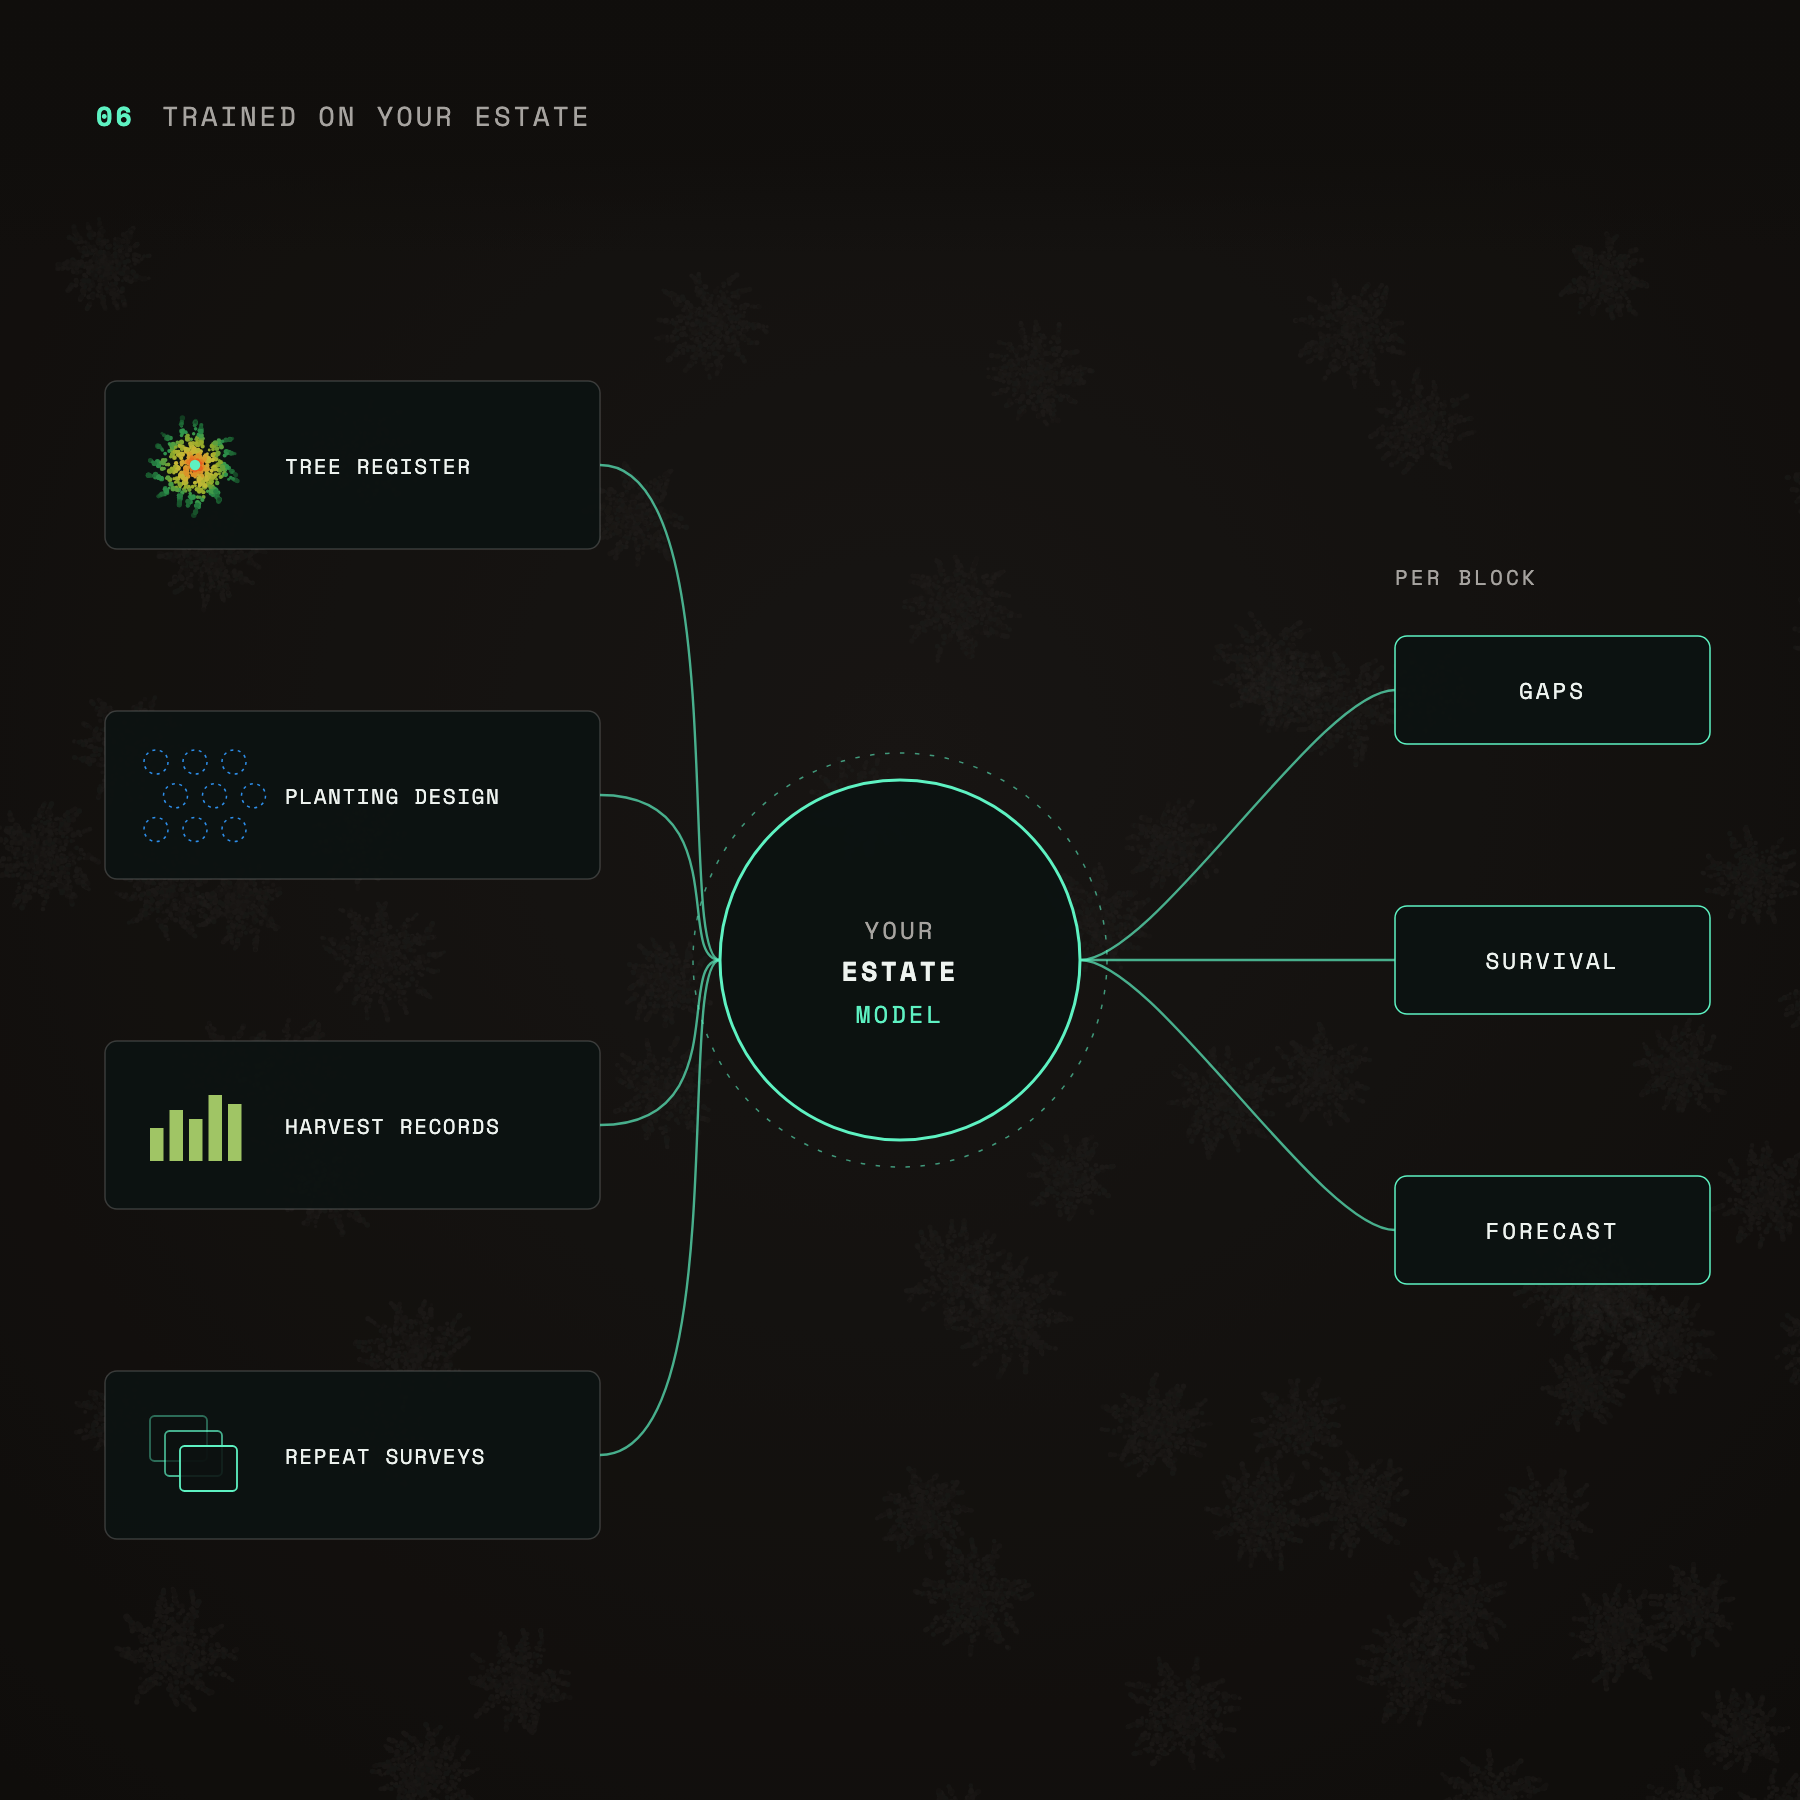
Trained on your estate: tree register, planting design, harvest records and repeat surveys feeding an estate model for gaps, survival and forecasts
Trained on your estate
Your tree register, planting design and harvest records feed a model built on your own estate.
get started now

Pick a span.
Leave with a crew list you can defend.